Uptime Kuma is a powerful, self-hosted, and open-source uptime monitoring tool with a user-friendly GUI that enables you to track the status of your services 24/7, ensuring minimal downtime and maximizing performance.
Implementing this solution isn’t just recommended for self-hosting enthusiasts—it’s a must. First, it simply works, reducing the chance of any service going offline without you being aware.
Moreover, you maintain full control over your data by hosting Uptime Kuma on your own server. Additionally, as a free and open-source tool, it eliminates the need for costly subscription-based monitoring services.
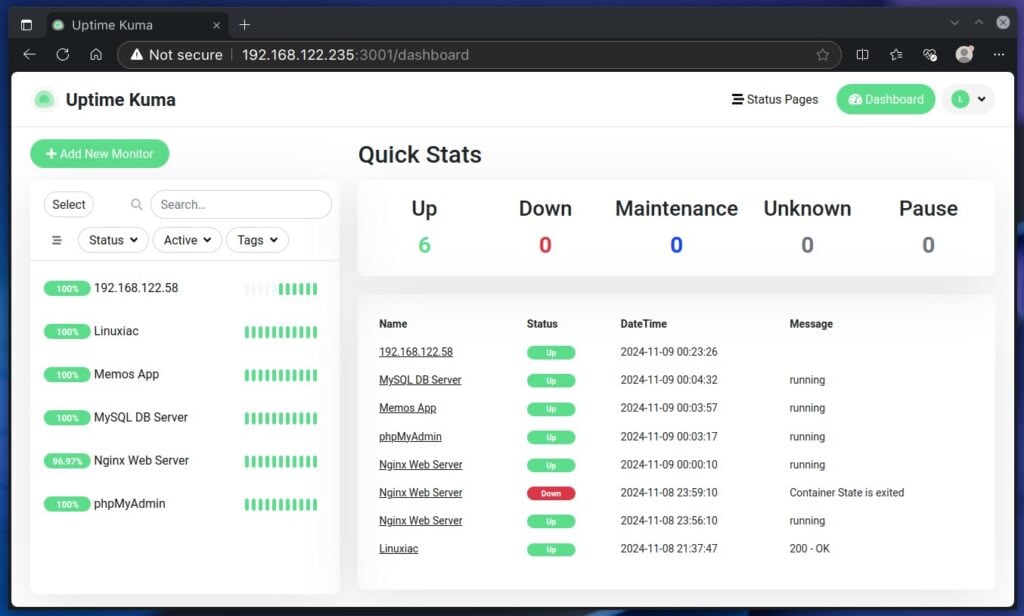
On the technical side, the software monitors a wide range of services using different protocols, such as HTTP(S), TCP, Ping, DNS, etc. Moreover, it supports a whole host of notification methods, including Email (SMTP), Slack, Telegram, Discord, Webhooks, Gotify, ntfy, Google Chat, Matrix, you name it.
In other words, the software is invaluable. That’s why, in this guide, we’ll walk you through installing and configuring Uptime Kuma using Docker Compose and help you effortlessly set up continuous monitoring. But before that, let’s shed some light on the software’s main applicability.
Uptime Kuma: Main Use Cases
Uptime Kuma provides continuous real-time monitoring of your websites, APIs, and network services. The best part is that by setting up periodic checks, the software instantly alerts you if any of your services go down. With that said, here are the primary use cases where Uptime Kuma shines:
- Website Uptime Monitoring: One of the most common uses of Uptime Kuma is for website monitoring. It allows users to check whether their website is up and accessible by setting up regular checks and receiving immediate alerts if a site goes down.
- Application Health Monitoring: Applications often rely on multiple services and databases to function smoothly. Uptime Kuma lets users monitor these components individually, tracking uptime and response time for each one.
- Server and Database Monitoring: Uptime Kuma can monitor servers and databases to ensure they remain accessible. For instance, a website may rely on a database for content delivery; if the database goes down, the site may become unresponsive. Kuma provides insights into server status and database availability, giving users the information they need to maintain a stable infrastructure.
- Monitoring SSL/TLS Certificates: Using Let’s Encrypt, and happen to forget when the certificate expires? Uptime Kuma can monitor certificates and send alerts when they are approaching expiration, so you can renew them before they become problematic.
- Self-Hosting Service Monitoring: Uptime Kuma is an excellent choice for tracking service uptime for those who host their services on-premises or through a private cloud. It lets users keep tabs on their self-hosted environments without relying on third-party monitoring services.
Well, I’m sure you’re impressed with the software’s capabilities—me too! Now, let me walk you through the steps to install and configure it so you can have round-the-clock monitoring for your services.
Prerequisites
Before proceeding with the installation, ensure Docker is installed on your system. But if you don’t have it, fear not; any of the following guides will help you get it quickly. Pick the distribution you are using in one of the following links: Ubuntu 24.04, Debian 12, Arch, Alma/Rocky, Fedora, Linux Mint 22, Pop!_OS 22.04, or Raspberry Pi OS.
The other essential component is Docker Compose. Recent Docker versions include Docker Compose by default, so you can install the “docker-compose-plugin” package. So, install it if it’s not already in your setup.
However, if you prefer, you can get it separately using both commands below. In that case, remember, when running the tool, type “docker-compose” instead of “docker compose.”
sudo curl -L "https://github.com/docker/compose/releases/latest/download/docker-compose-linux-$(uname -m)" -o /usr/local/bin/docker-compose
sudo chmod +x /usr/local/bin/docker-composeCode language: Bash (bash)
Install Uptime Kuma with Docker Compose
The first step is to create the project directory in which our Docker Compose deployment file will be placed. Then switch to it; from here on, you need to execute all commands further down in this guide from that location.
mkdir kuma
cd kumaCode language: Bash (bash)
Next, create a “docker-compose.yml” file, like a blueprint for our Docker setup. This file will define the services, volumes, ports, etc., telling Docker Compose what to do and how to set up our Uptime Kuma instance.
Open your favorite text editor and paste the following content into it:
nano docker-compose.ymlCode language: Bash (bash)services:
uptime-kuma:
image: louislam/uptime-kuma:2
container_name: kuma
volumes:
- ./data:/app/data
ports:
- 3001:3001
restart: alwaysCode language: YAML (yaml)Well, as you can see, our deployment is the simplest possible. The “volumes” option will create a “data” directory in the current one and mount it to the container’s “/app/data” directory, ensuring data persistence. We also expose the container’s port 3001 and bind it to the host’s port 3001, which we will use to access the Uptime Kuma web UI.
And that’s it! Now, execute the following command to start and run the container in the background (detached mode):
docker compose up -dCode language: Bash (bash)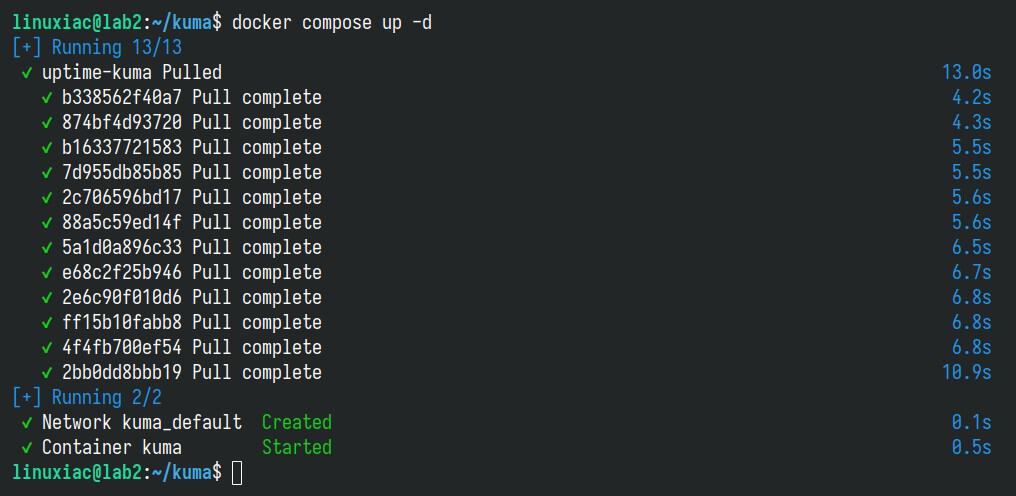
The Docker image will start downloading. At the end, you should see a screen similar to the one above confirming that your Uptime Kuma installation has been successfully deployed and that the container is up and running. It was easy, right?
Now, let’s move to the most exciting part. Open your browser and navigate to “http://localhost:3001” or “http://<server-ip-address>:3001“. Of course, replace the “<server-ip-address>” part with your actual server’s IP address.
When you first access Uptime Kuma, you’ll be prompted to create an admin account. Fill in the username and password fields and click “Create.”
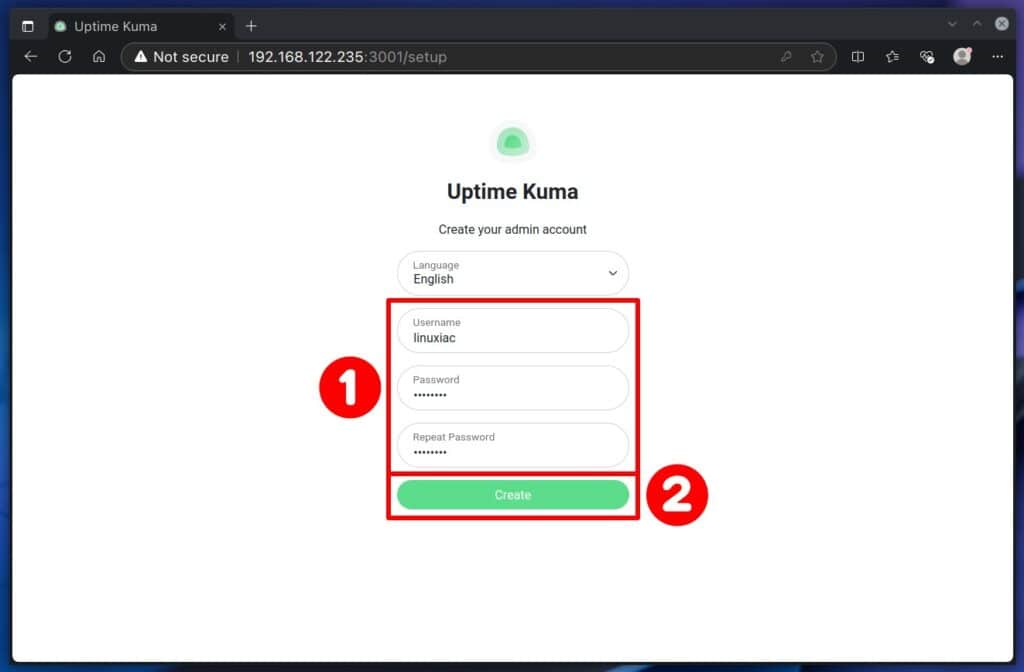
Just like that, you’re logged into your brand new Uptime Kuma instance. But before adding your first monitoring configuration, it’s a good idea to set up notifications.
Doing this lets you easily add a notification to each new monitor with a single click, instead of configuring them individually each time. Think of it as creating a reusable template for notifications.
Configure Uptime Kuma Notifications
Uptime Kuma notifications are alerts that notify you when the status of the services, websites, or systems you’re monitoring changes—like when they go down, experience errors, or come back online. These notifications can be set up to keep you informed in real-time, helping you respond quickly to issues.
Click on the dropdown menu at the top right corner, choose “Settings,” then select the “Notifications” option from the page that will load, and hit the “Setup Notification” button.
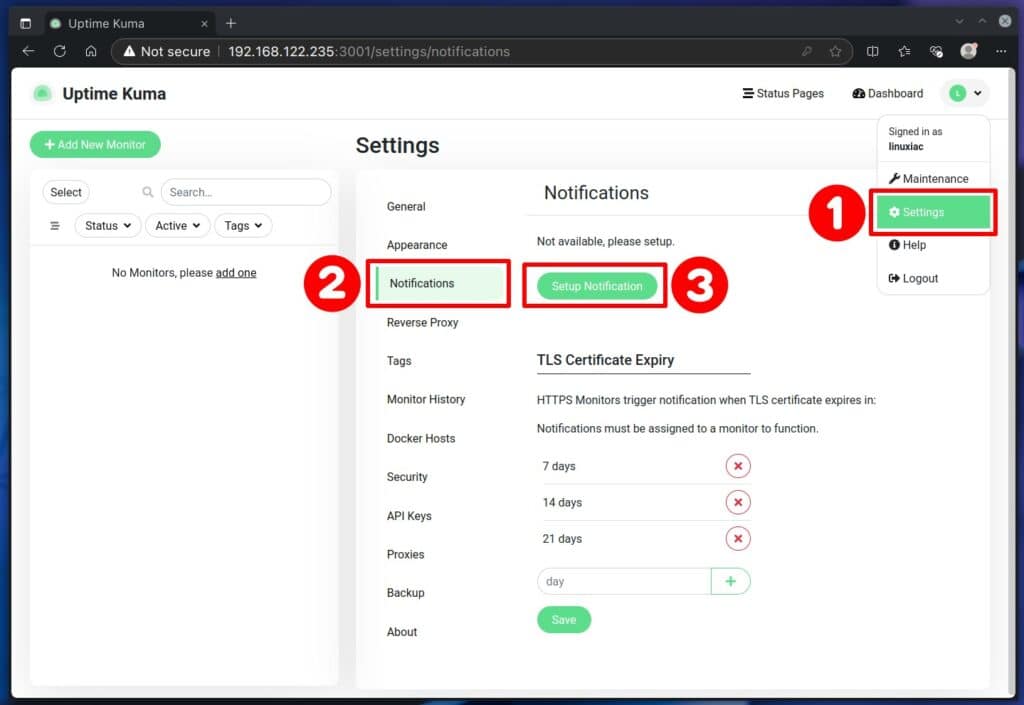
This is where Uptime Kuma truly shines—it supports nearly any notification service you can imagine (and probably even a few you haven’t heard of). Below, I’ve provided a quick overview of some main ones.
- Alerta: An alert management tool for consolidating and visualizing alerts from different sources.
- Apprise: A powerful tool that connects to over 50 notification services, offering broad integration flexibility.
- Discord: A popular chat app, especially among communities, used to send alerts to specific channels.
- Email (SMTP): Sends email notifications using SMTP to inform users via their inbox.
- Google Chat: Sends alerts to Google Chat rooms in Google Workspace environments.
- Gotify: A self-hosted notification server for sending push notifications.
- Home Assistant: An open-source platform for home automation that can receive alerts for monitoring status.
- Microsoft Teams: A collaboration platform that can receive notifications in specific channels.
- Ntfy: A simple and open-source push notification service.
- Pushbullet: A service that lets you send alerts to mobile devices and desktops.
- Pushover: A service that sends real-time notifications to mobile devices and desktops.
- Pushy: A push notification service for Android and iOS devices.
- Signal: A secure messaging app that can receive alerts.
- Slack: A widely used team messaging app for sending alerts to channels.
- Telegram: A popular messaging app with secure and fast notifications.
- Webhook: A customizable notification option that sends alerts to any URL, enabling integrations with other apps.
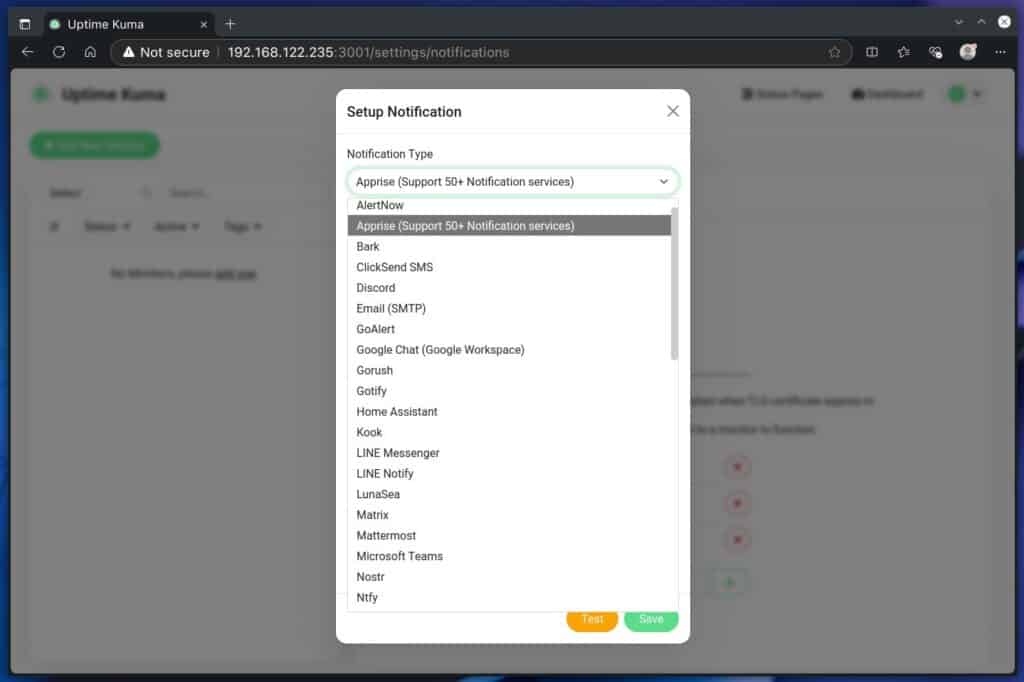
However, I can’t tell you which specific service to choose here since it really depends on your personal preferences and, most importantly, which platforms you use most often, are registered on, and have installed on your phone if you want to receive notifications there.
If I had to give a simple example, though, setting it up is a breeze if you’re using Discord. You just need to paste Discord’s webhook URL into Uptime Kuma’s notification settings for the Discord service. The official app’s documentation contains good instructions on how to generate a Discord webhook URL.
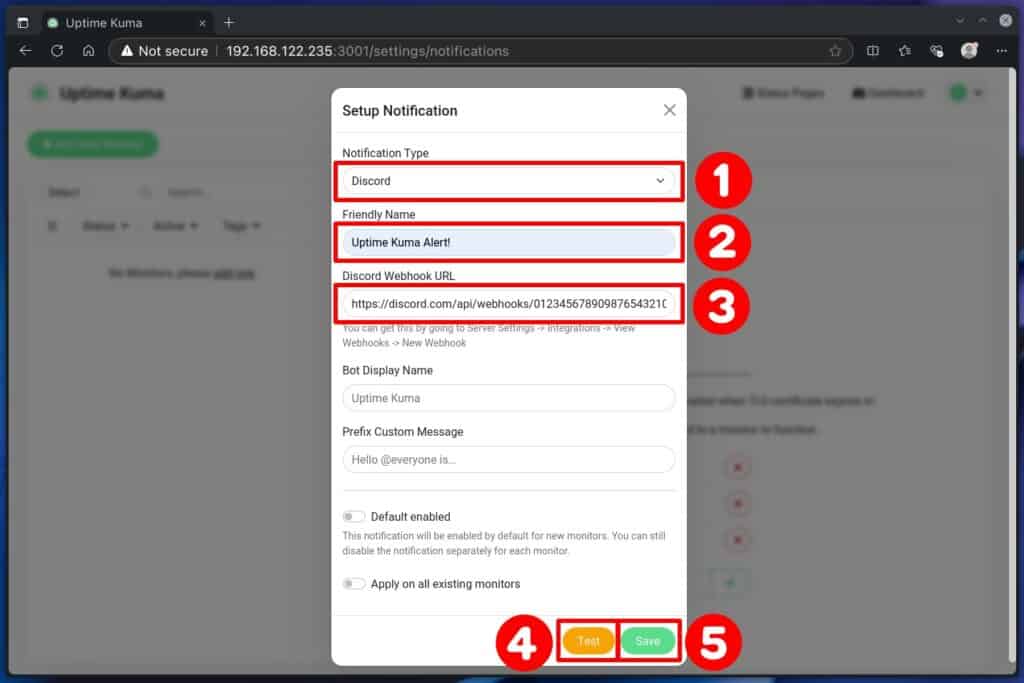
Once you’ve entered the correct information, simply click the “Test” button. You’ll instantly receive a test message in Discord confirming a smooth integration with Uptime Kuma. After that, just click “Save” to apply your settings.
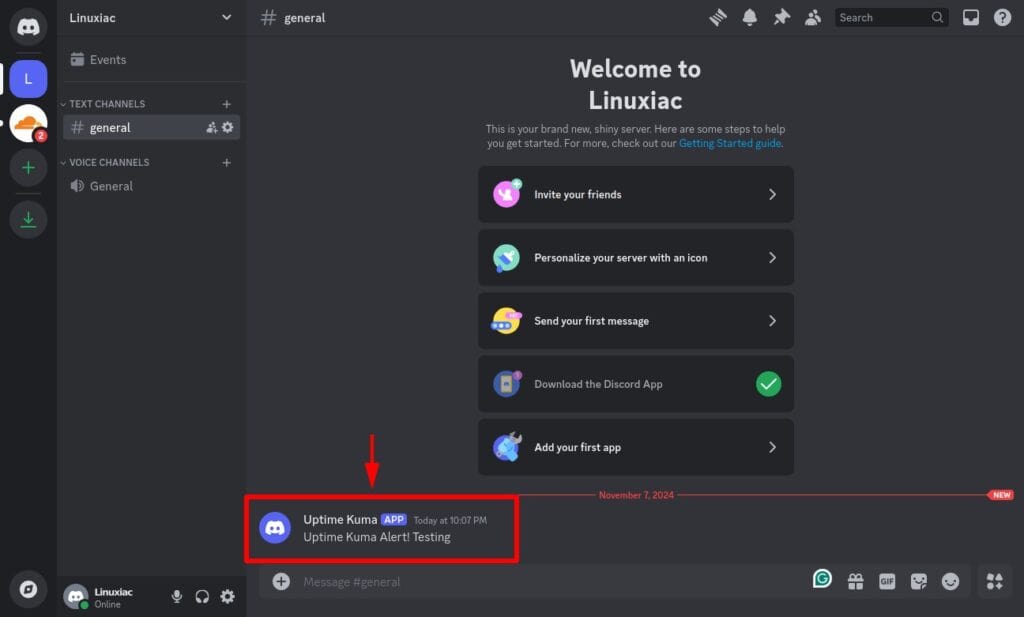
Once again, the Discord notification example above is only that—an example. If you’re reading this guide, you likely have experience with self-hosted solutions you want to monitor. I mean, it would be easy for you to set up a service that serves as a notification provider for Uptime Kuma.
On a related note, if you’re curious about my personal preference, I lean heavily toward using a self-hosted Gotify or ntfy instance – they are free and open source, which matters to me. So, I use both and find them incredibly reliable and easy to tailor to my specific needs, giving me complete control over the setup.
So much for that. Now, let’s dive into the real focus: setting up monitoring.
Adding a New Monitor to Uptime Kuma
Now, we’re at the most exciting part of the guide—adding your very first monitor! Luckily, this is a breeze, thanks to Uptime Kuma’s user-friendly web interface. Simply click the “Add New Monitor” button in the top left corner, and you’ll be taken to a setup page.
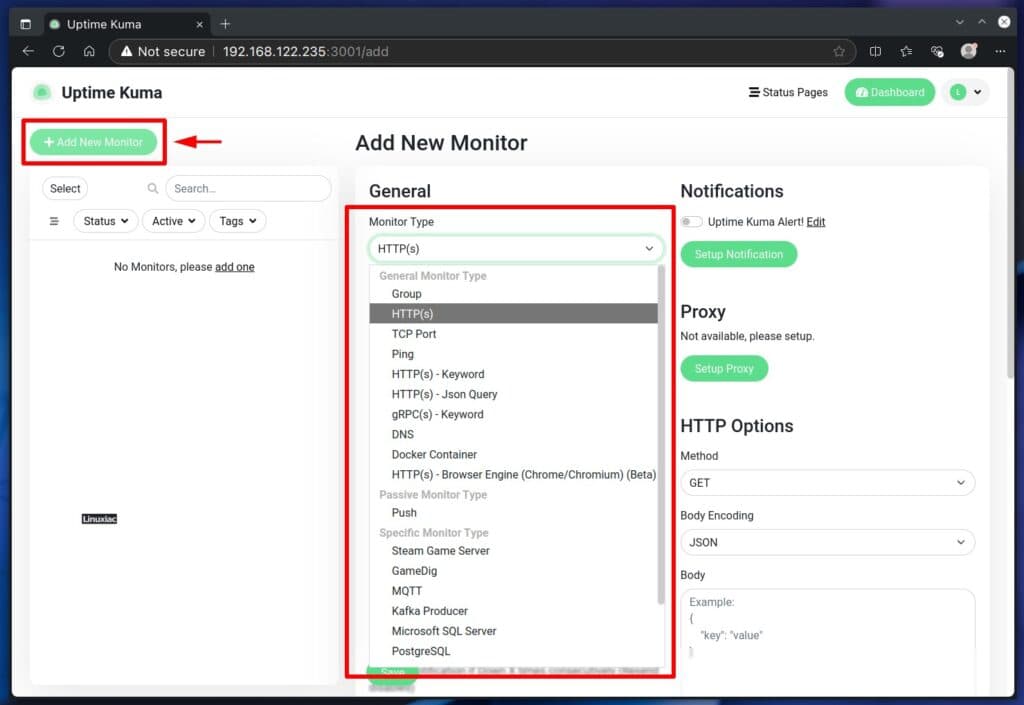
Under “Monitor Type,” you’ll find several monitoring options. Here are the main and most commonly used ones:
- HTTP(s): For websites and APIs accessible via HTTP or HTTPS.
- TCP Port: To monitor a specific TCP port.
- Ping: To check if a host is reachable.
- DNS: To check DNS resolutions.
- Docker Container: Track the container’s state (running, stopped, restarting, etc.).
- Push: A mechanism for remotely checking whether Uptime Kuma itself is online.
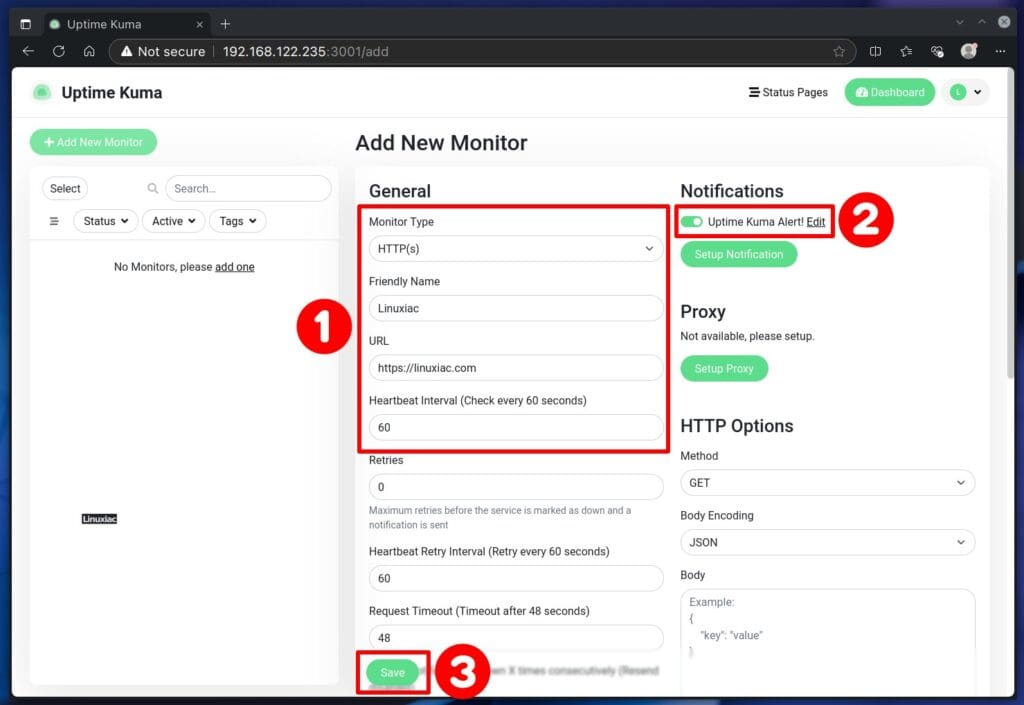
Let’s set up one of the most popular monitoring tools: checking if a website is accessible. Start by selecting “HTTP(s)” under “Monitoring Type,” then enter a name that will be easy for you to recognize in the “Friendly Name” field. In the “URL,” input the site’s address. Leave the “Heartbeat Interval” at the default 60 seconds, which means it will be checked for availability every minute.
Next, switch on the notifications toggle (I hope you created one earlier, as mentioned above in this guide) so you’ll receive alerts when the site’s status changes – if it goes offline and when it’s back online. Finally, hit “Save” to confirm and start monitoring.
And just like that, now you’ve got reliable monitoring set up, so if anything happens to disrupt your website, you’ll be ready to respond instantly.
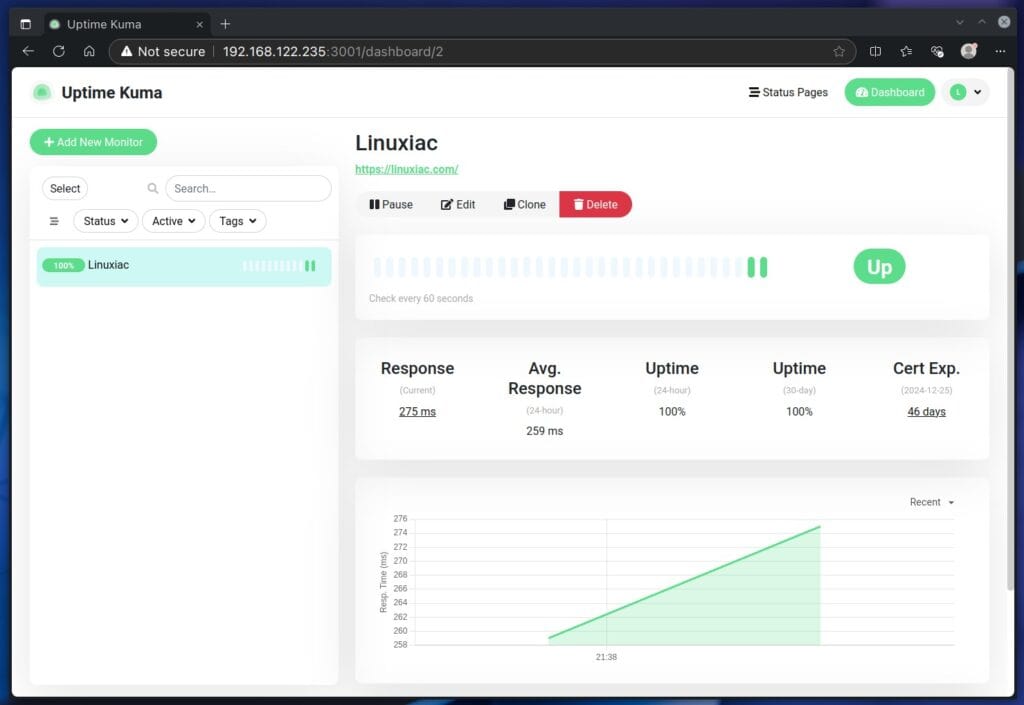
You should have a solid understanding of setting up Uptime Kuma monitors by now. I bet you’re excited to start adding these to your key services—so go for it! But we’re not done yet—I want to show you another useful functionality to make the most of your Kuma instance.
Monitoring Docker Containers with Uptime Kuma
Yes, keeping an eye on your servers and websites is essential. But how do you monitor those if you’re like many these days and rely on Docker containers for your various services? That’s where Uptime Kuma shines once again.
It lets you keep tabs on any container to ensure it’s running smoothly. Here’s how to make the most of this great Kuma feature.
Add the following mount point in the “docker-compose.yml” file to connect the local “/var/run/docker.sock” with the same location into the Uptime Kuma container. This will allow Kuma to see and monitor the Docker containers running on the host system.
To do so, first stop Uptime Kuma (if it is running):
docker compose downCode language: Bash (bash)Then open the “docker-compose.yml” file and add the required mount point so that the final version looks like this:
nano docker-compose.ymlCode language: Bash (bash)services:
uptime-kuma:
image: louislam/uptime-kuma:1
container_name: kuma
volumes:
- ./data:/app/data
- /var/run/docker.sock:/var/run/docker.sock
ports:
- 3001:3001
restart: always
Code language: YAML (yaml)Finally, start the deployment again.
docker compose up -dCode language: Bash (bash)Next, go to the web interface, click on “Settings,” then select “Docker Hosts,” and hit the “Setup Docker Host” button.
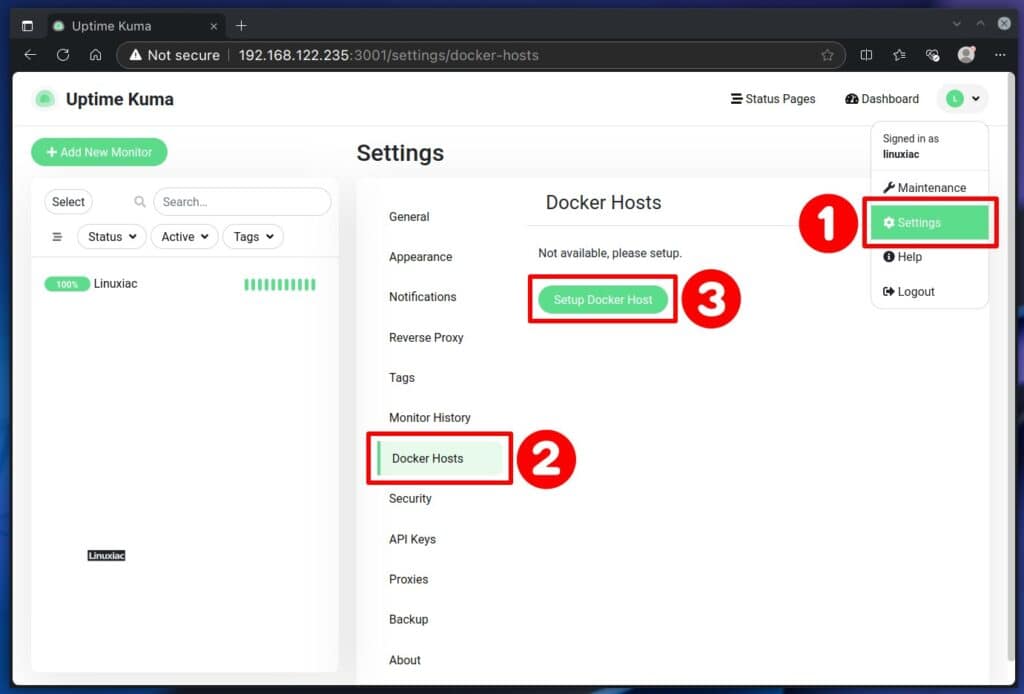
Feel free to pick any name you like for the “Friendly Name” field. I’m not the most creative person when it comes to naming, so I usually just go with something straightforward like “Docker.”
For “Connection Type,” choose “Socket,” and for “Docker Daemon,” select “/var/run/docker.sock.” Once you’ve got that setup, test the connection to ensure everything’s working, then hit “Save” to finalize it.
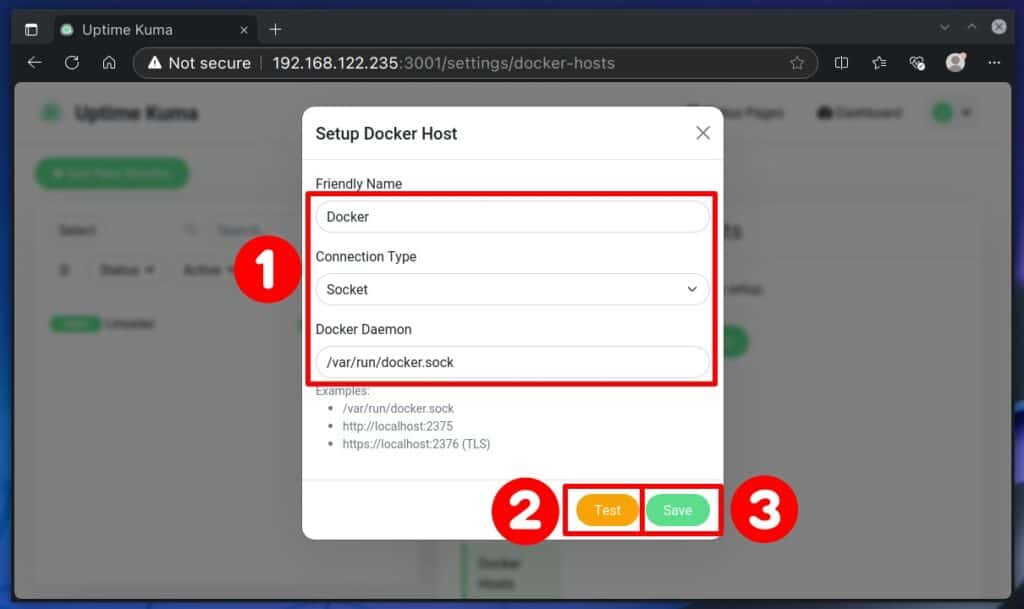
Alright, let’s head back to the admin interface. Click on “Add New Monitor,” then choose “Docker Container” as the monitor type. Name it to help you easily identify which container you’re tracking.
In the “Container Name / ID” field, enter the container name you want Uptime Kuma to monitor. If you’re unsure of the name, just log in to the host and run the command below to see the IDs and names of all running containers.
docker psCode language: Bash (bash)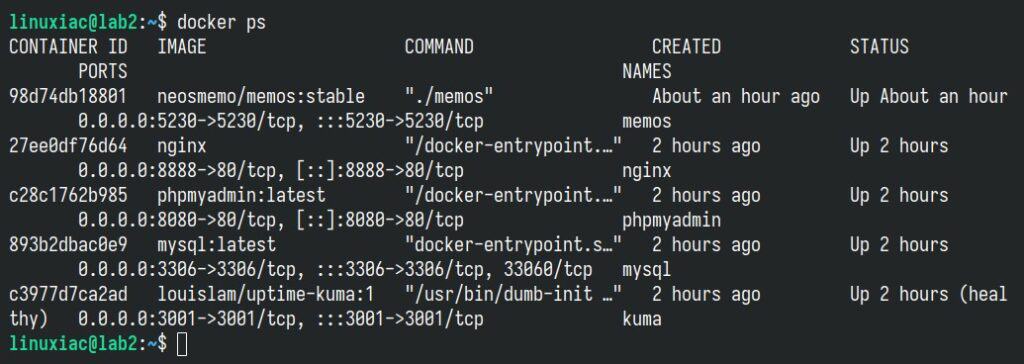
While this command works wonderfully, we can make it even easier. It’s definitely clearer this way, wouldn’t you agree?
docker ps --format "{{.ID}}: {{.Names}}"Code language: Bash (bash)
For clarity, I recommend using the container’s name rather than its ID, but it’s totally up to you. Armed with this information, enter the container’s name (or ID) you want to monitor. In our case, it is “nginx.”
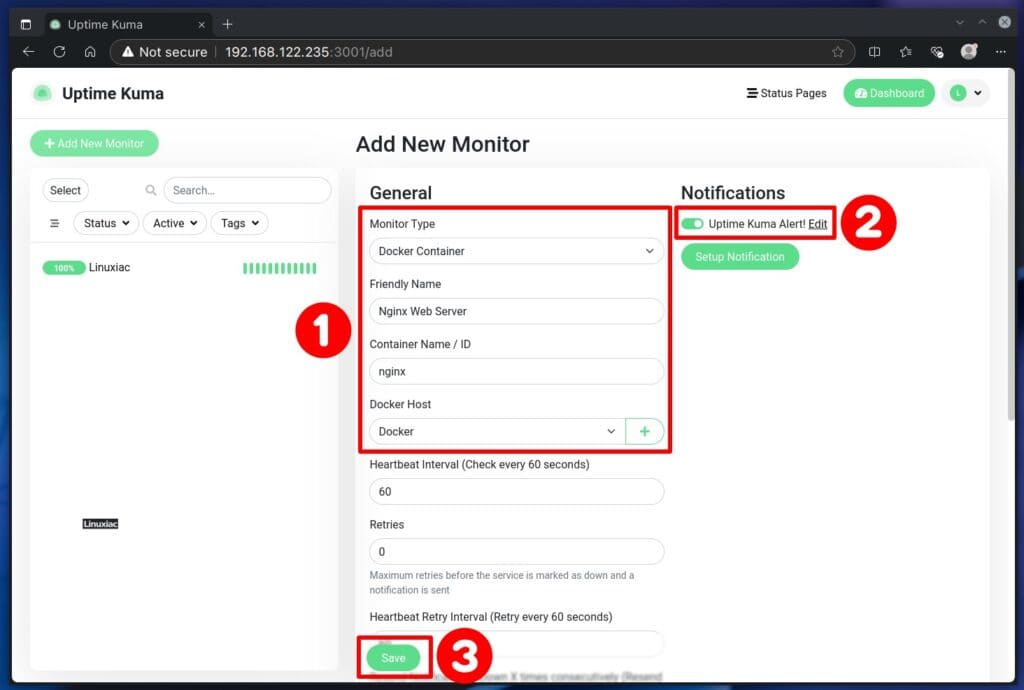
Remember to attach a notification and finally save the settings. And there you have it—reliable monitoring for your containers is all set.
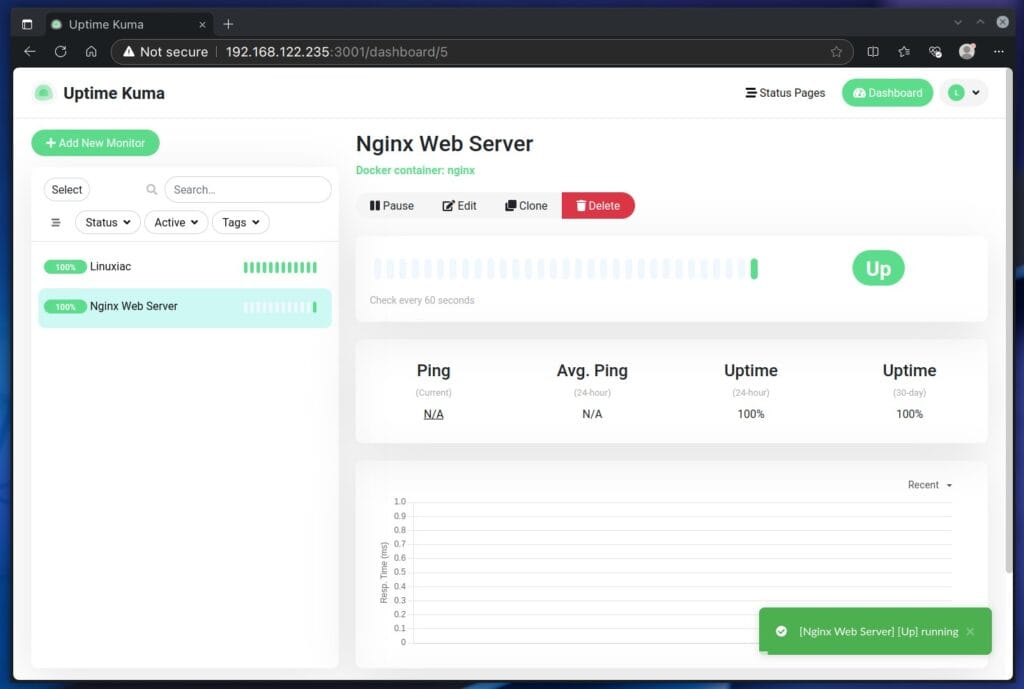
Just repeat the process for any other containers you want to monitor. For a quick and easy way to check out your container logs, I strongly suggest our guide, “Installing Dozzle: A Fantastic Real-Time Docker Log Viewer.” It’s straightforward and helpful—you won’t be disappointed.
Conclusion
Thank you for following our Uptime Kuma Docker installation and configuration guide! With Uptime Kuma now set up, you’re well-equipped to keep a watchful eye on your services and ensure they stay live around the clock.
Of course, the software has plenty more to offer. For a complete look at everything it can do, we recommend checking out the project page on GitHub, especially the Wiki section.
I hope this guide was helpful and made the process straightforward for you. If you have any questions or feedback, feel free to reach out in the comment section below. Happy monitoring!
