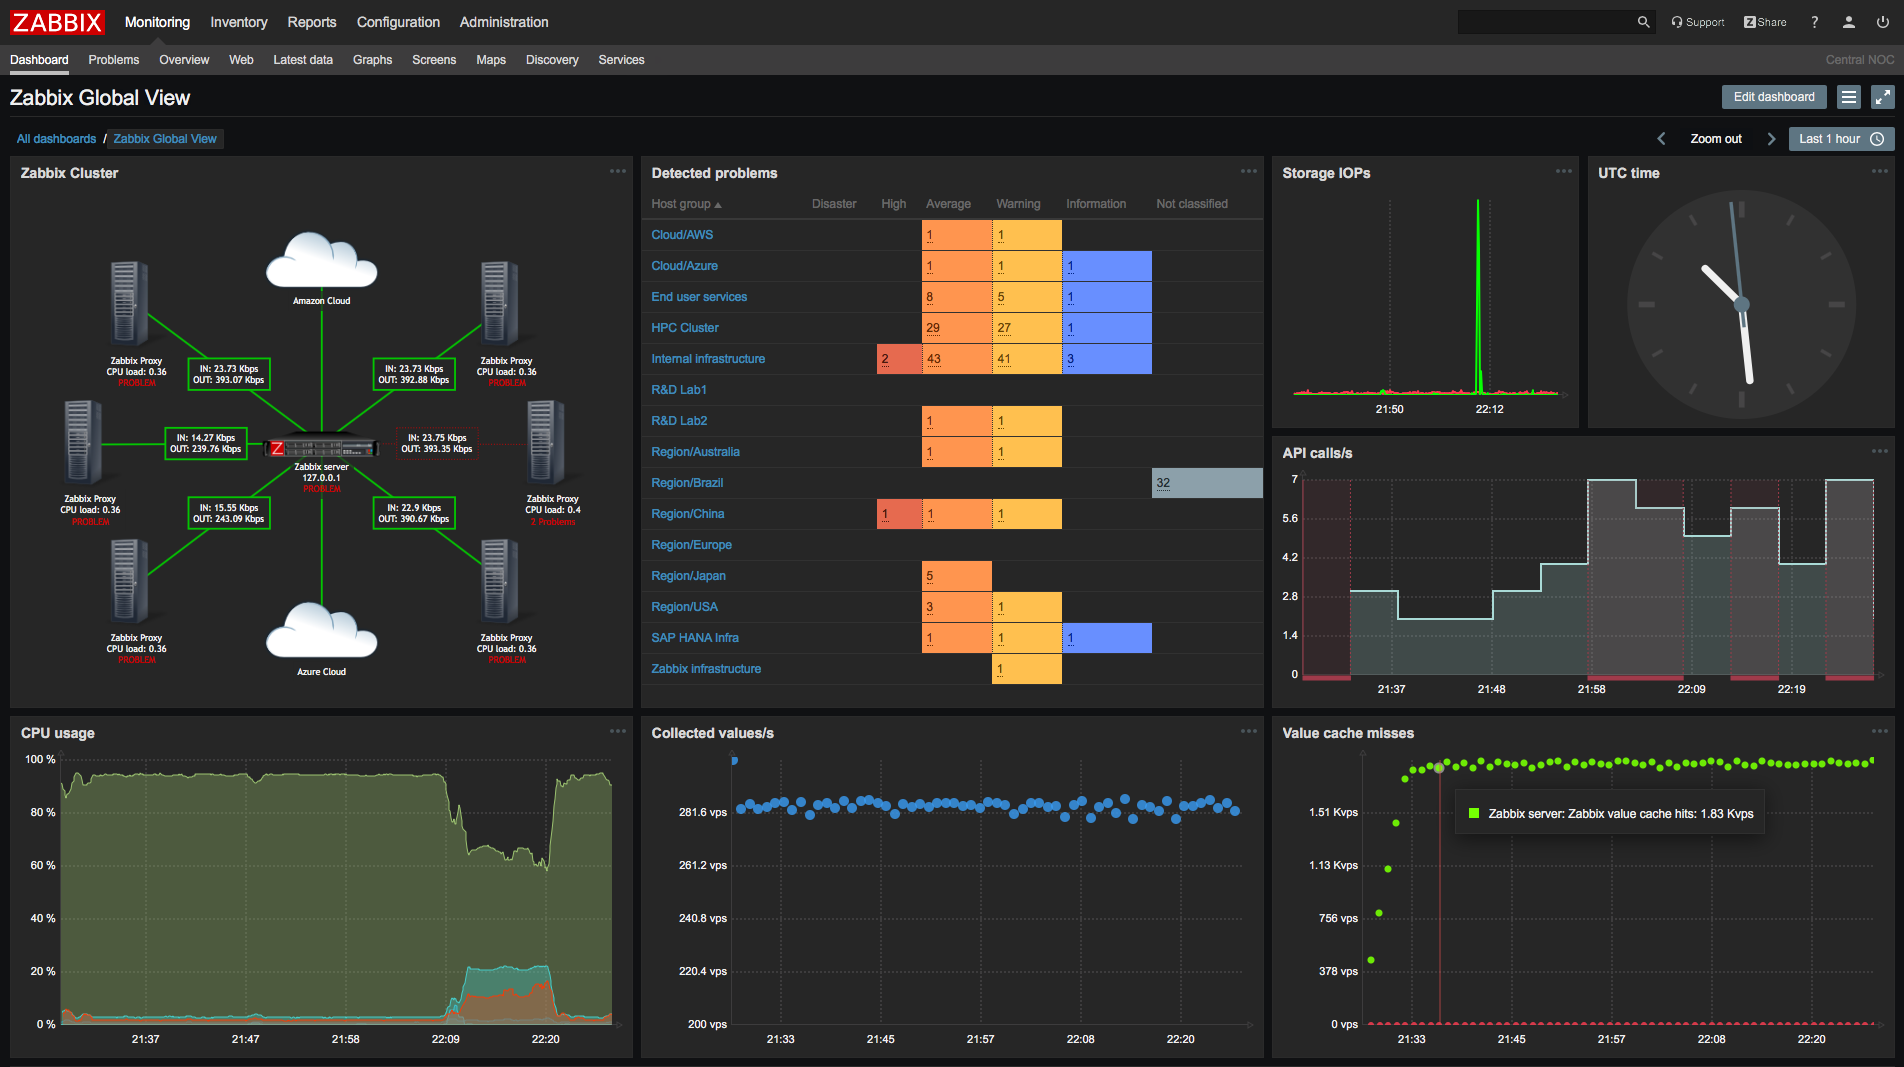
Zabbix is an open source, real-time application, and network monitoring tool. It offers monitoring of thousands of metrics collected from physical machines or virtual machines. Zabbix has a web-based management interface which is centralized through a database. With Zabbix, visualization of your data is available in the form of graphs, screens, maps and overviews.
Zabbix is composed of the following components:
- Zabbix server: Provides Zabbix’s central monitoring functions. Executes monitoring. Stores monitoring configuration and monitoring data in databases.
- Zabbix Web server: Web interface for configuring and displaying Zabbix monitoring data.
- Zabbix proxy servers: Servers are distributed in locations not transparent on the network. Carry out monitoring in place of the Zabbix server and exchange monitoring configuration and monitoring data with the Zabbix server.
- Zabbix agent: Agent that acts on the monitored target. Sends the target’s monitoring data to the Zabbix server.
What’s new in Zabbix 5.4
Scheduled PDF report generation
Zabbix will generate and send customized daily, weekly, or monthly PDF reports. Now any Zabbix dashboard can be turn into PDF report. Access to this functionality is controlled by a new user role.
New templates
In addition to existing templates, Zabbix 5.4 includes templates for monitoring APC UPS hardware, Hikvision cameras, etcd, Hadoop, Zookeeper, Kafka, AMQ, HashiCorp Vault, MS Sharepoint, MS Exchange, smartclt, Gitlab, Jenkins, Apache Ignite, and more applications and services.
Advanced data aggregation
The aggregation capabilities of Zabbix were extended to support the selection of metrics by host groups, metric wildcards, and tags. It simplifies data aggregation for capacity planning, business-level monitoring, and advanced problem detection. The existing functionality of aggregated metrics was merged into calculated metrics for simplicity.
In addition to, now Zabbix uses unified syntax for everything: triggers and calculated metrics.
More power to tags
Zabbix 5.4 drops support of host-level applications and replaces them with metric tags. Now tags are supported for all critical objects in Zabbix: templates, hosts, host prototypes, triggers, metrics, and events.
Improved scalability
Zabbix Server introduces support of in-memory cache for trend data that significantly improves the performance of trigger functions working with trend data. Now Zabbix Server performs graceful startup to evenly distribute processing of a large amount of data coming from proxies. The performance of the Zabbix Server was improved by reducing history syncer usage in heavy parallel workloads.
For detailed information you can refer to the full changelog or project’s website.