Everyone will agree that Linux monitoring tools are required to ensure a healthy Linux infrastructure. Hence, a performance monitoring solution becomes vital to observe your Linux systems’ health, activities, and capability.
Fortunately, there are many Linux monitoring tools available out there. This article will discuss five lightweight terminal-based and free-to-use tools to monitor servers and desktops running Linux.
Below discussed terminal-based monitoring tools help you monitor all kinds of system resources on your Linux box.
1. top
The top (table of processes) command is one of Linux’s primary system and process monitoring tools. The command top shows a list of running operations alongside standard CPU metrics and memory usage by default.
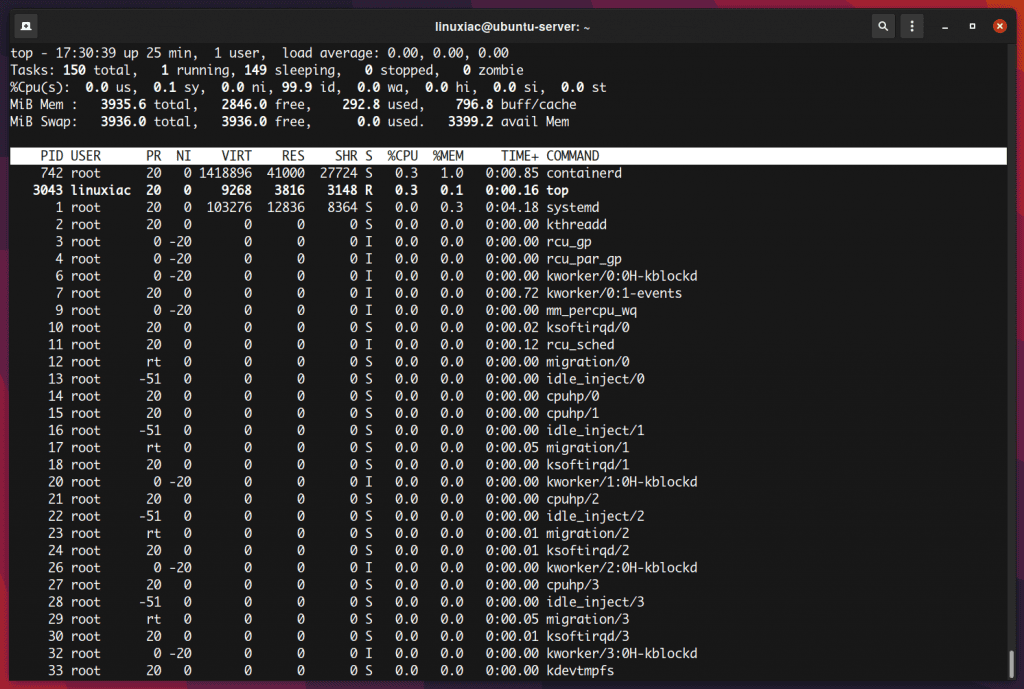
Running this command will open an interactive command mode window where the top half portion will contain the statistics of processes and resource usage. The lower half includes a list of the currently running processes.
The top command is a simple but helpful way to see what programs are currently running on the system and how heavily they use system resources. The good news is that this utility comes pre-installed with all Linux distros.
For more information, visit the top command manpage.
2. htop
The htop command in a Linux system is a command-line utility that allows the user to interactively monitor the system’s vital resources or server’s processes in real time. It can be considered a Linux counterpart of Windows Task Manager.
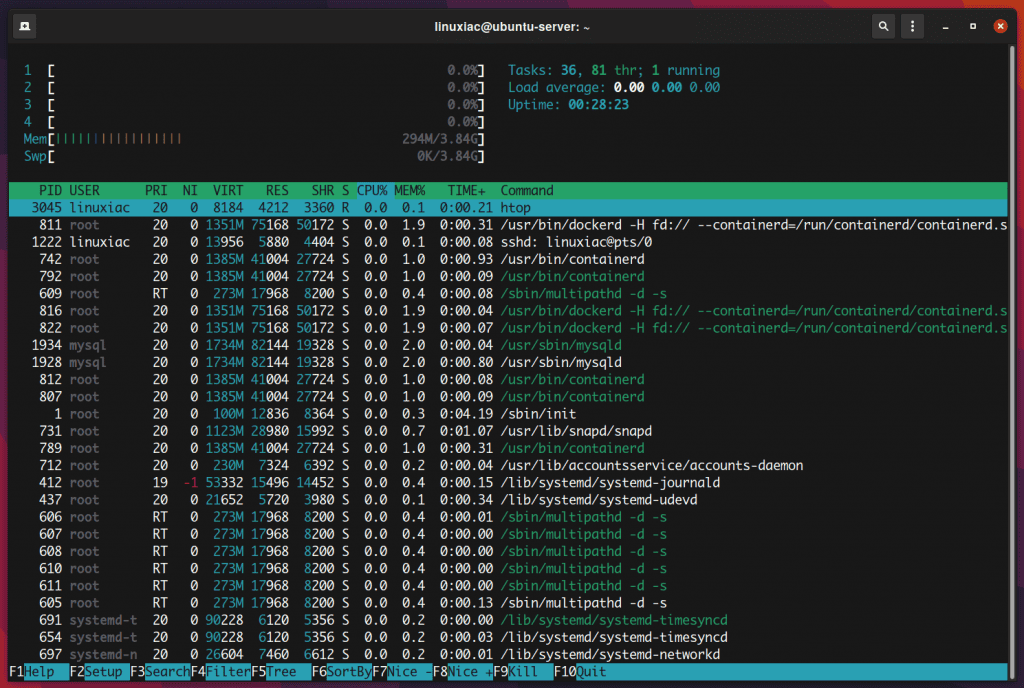
The command offers many improvements over the top command. For example, you can interact with the htop using a mouse. In addition, you can scroll vertically to view the whole process list and horizontally to view the full command line of the process.
In addition, htop uses color in its output and visual indications about CPU, memory, and swap usage.
For more information, visit the htop website.
Install htop on Ubuntu / Debian
htop package for Ubuntu and Debian is available in the default repositories, so type:
sudo apt install htopInstall htop on CentOS / Rocky Linux / AlmaLinux
First, you must install the EPEL repo on your system, if not installed, and then install the htop package:
sudo dnf install epel-release
sudo dnf install htop
3. btop
btop is a cross-platform command-line utility that comes with support for mouse controls so that you can fully navigate it through mouse inputs only. In addition, it displays real-time usage and stats for CPU, memory, storage, network, and processes.
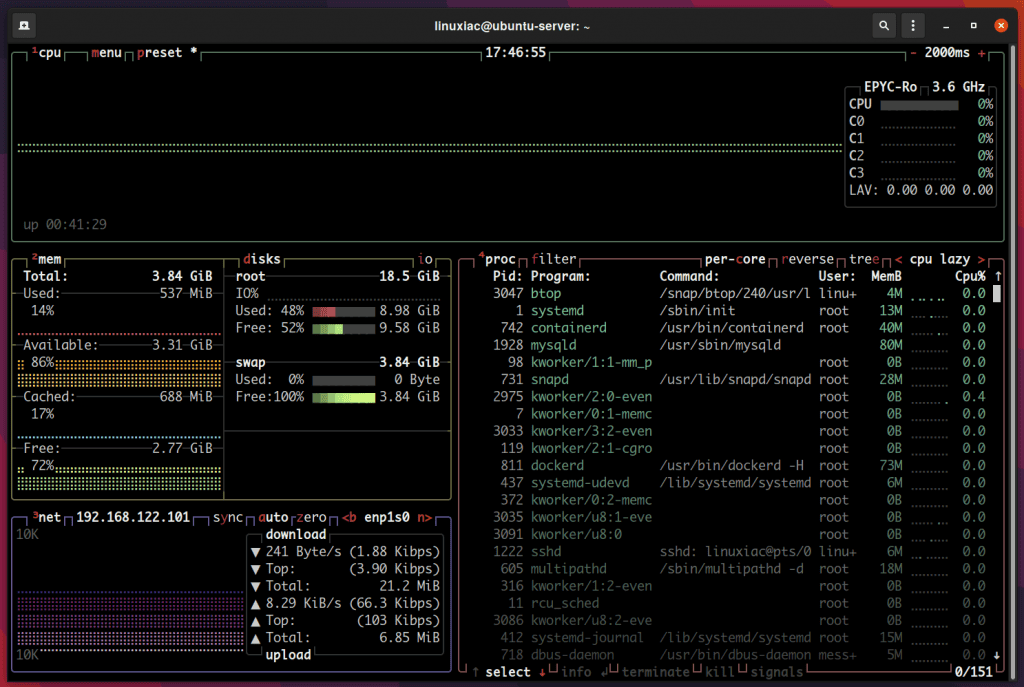
With btop, you can quickly view detailed stats for processes, easily switch between sorting options, send SIGTERM, SIGKILL, and SIGINT to a selected process, view current read and write speeds for your storage devices, and much more.
For more information, visit the btop GitHub page.
Install btop on Ubuntu / Debian
The easiest way to install btop on Ubuntu or Debian is to install it as a Snap package. So, first install snapd, if not installed, and then install the btop package using snap:
sudo apt install snapd
sudo snap install btop
Install btop on CentOS / Rocky Linux / AlmaLinux
First, you need to enable EPEL repo, if not installed, and then install Snap:
sudo dnf install epel-repo
sudo dnf install snapd
Once installed, the systemd unit that manages the main snap communication socket needs to be enabled:
sudo systemctl enable --now snapd.socketCode language: CSS (css)To enable classic Snap support, enter the following to create a symbolic link between /var/lib/snapd/snap and /snap:
sudo ln -s /var/lib/snapd/snap /snapCode language: JavaScript (javascript)Either log out and back in again or restart your system to ensure snap’s paths are updated correctly.
And then install the btop package:
sudo snap install btop4. nmon
nmon is a system’s administrator tuner and benchmark tool that displays the performance of the CPU, memory, network, disks, file system, NFS, top processes, resources, and power micro-partition.
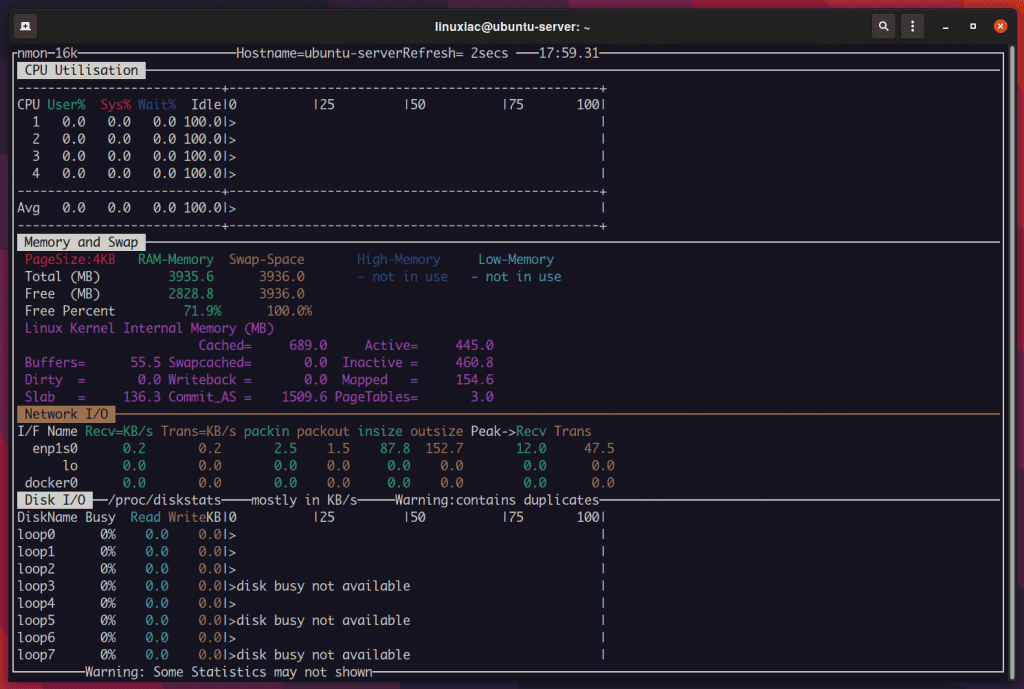
In addition, to display the system resource usage in real-time, you can also write the data generated by nmon in a file, which is extremely helpful in some situations. In other words, nmon can snapshot the data into a .csv file to work with later on.
For more information, visit the nmon website.
Install nmon on Ubuntu / Debian
nmon package for Ubuntu and Debian is available in the default repositories, so just type:
sudo apt install nmonInstall nmon on CentOS / Rocky Linux / AlmaLinux
First, you must install the EPEL repo on your system, if not installed, and then install the nmon package:
sudo dnf install epel-release
sudo dnf install nmon
5. glances
Written in Python, glances is a cross-platform monitoring tool that provides information about your system’s performance. It monitors system resources in standalone mode (results are displayed on the terminal), client/server mode, or web server mode (results displayed in a web browser).
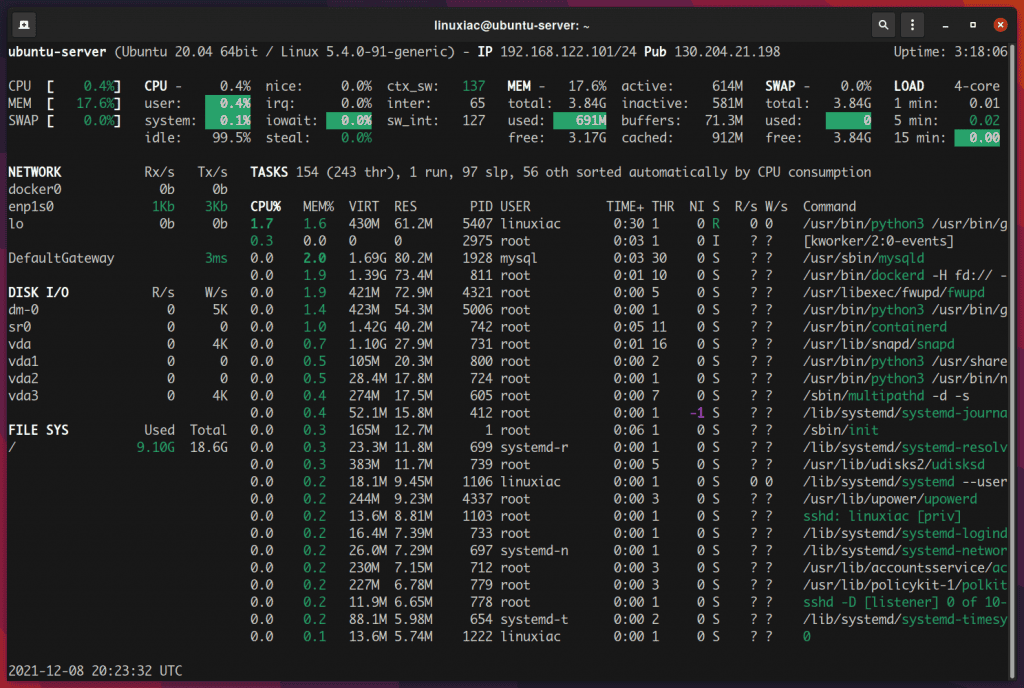
All of the above-mentioned Linux monitoring tools can monitor CPU and memory usage and list information about running processes.
However, glances also monitor filesystem I/O, network I/O, and sensor readouts that can display CPU and other hardware temperatures, fan speeds, and disk usage by a hardware device and logical volume.
For more information, visit the glances website.
Install glances on Ubuntu / Debian
glances package for Ubuntu and Debian is available in the default repositories, so type:
sudo apt install glancesInstall glances on CentOS / Rocky Linux / AlmaLinux
First, you must install the EPEL repo on your system, if not installed, and then install the glances package:
sudo dnf install epel-release
sudo dnf install glances
Conclusion
Terminal monitoring provides that quick and easy way to look into what is happening on your Linux system immediately.
So, these were our picks for the best Linux terminal-based monitoring tools. We hope the list was helpful and helped you find the right tool to monitor your system usage and resource consumption.
So, what would you pick to monitor your Linux system?

There writer asked them wrong question. There best app to monitor our Linux system is not terminal based. It of a GUI with a silly menu system, at this moment: GKRELLM.
The best version of this is currently on PCLOS. GKRELLM has very basic versions on most other Linux operating systems, and one very simpler version for Microsoft Windows.
Gkrellm is so good, when expertly configured, that it is better than a set of three best of Windows other, realtime desktop monitors.
CoreFreq to monitor and tweak processors
github.com/cyring/CoreFreq
Well they all do the same thing, what you should improve is your ability to interpret what is showing after that it is really just what interface you like more