Grafana, an open-source cloud-native observability platform for visualizing metrics, logs, and traces, announced the general availability of version 12.4. Here are the highlights.
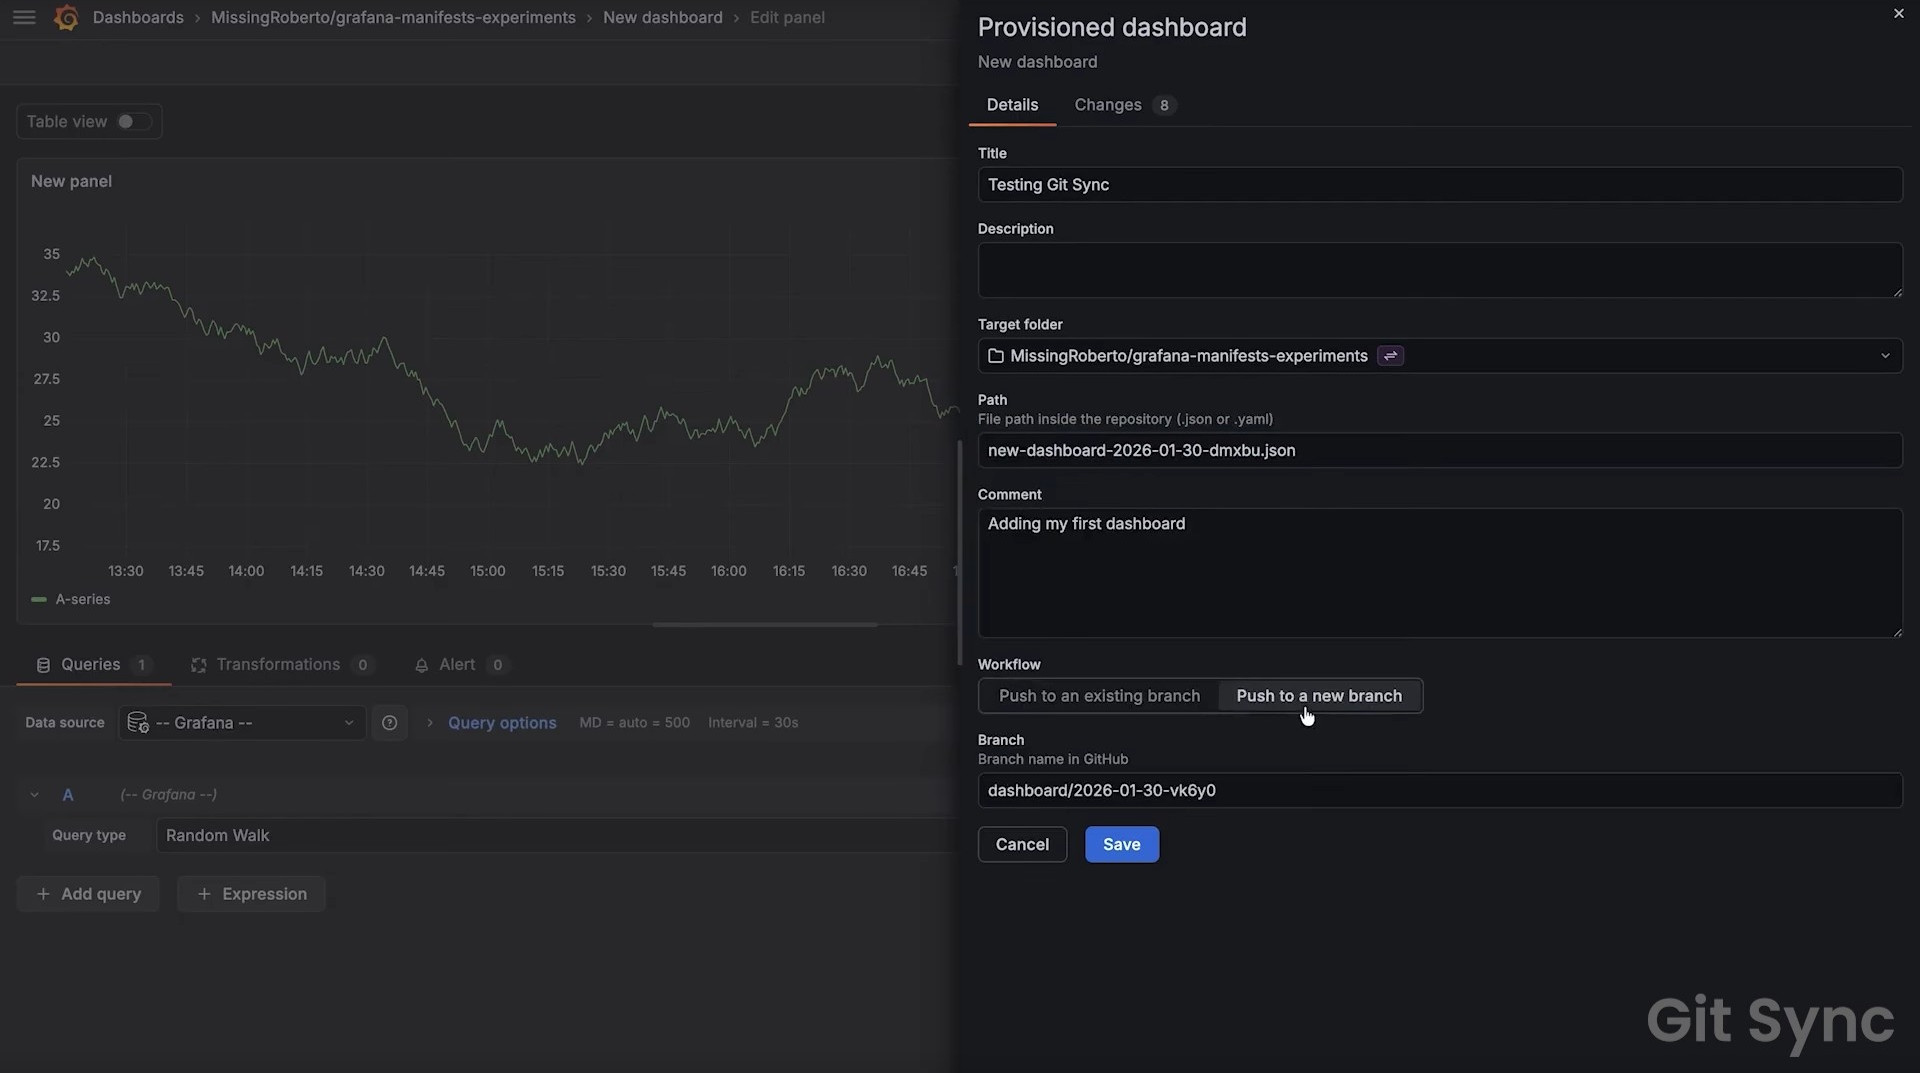
Git Sync is now in public preview for Grafana Cloud and marked experimental in OSS and Enterprise editions. This feature allows teams to version dashboards, manage pull requests, and approve changes through Git workflows. In addition, GitHub App authentication has been added, and branch selection in the save workflow has been enhanced.
Dynamic dashboards, now also in public preview across all editions, include significant usability enhancements with flexible horizontal and vertical tabs that help teams structure content for different audiences, while show-and-hide rules dynamically adjust panel visibility based on variables or data.
Moreover, the new Auto grid layout automatically adapts panel sizing to available screen space and works with conditional visibility to prevent layout gaps. Grafana has replaced the secondary top toolbar with a side toolbar to increase vertical workspace and added a clickable dashboard content outline to streamline navigation and editing.
Grafana 12.4 also introduces Suggested dashboards. After configuring a data source, users receive curated, pre-built dashboards relevant to that source, sourced from Grafana Labs and the open-source community.
Time series exploration is enhanced with new pan and zoom controls for time ranges. Users can shift entire dashboard time windows forward or backward, drag along the x-axis for precise navigation, and zoom into selected intervals directly within panels.
On the log exploration side, Grafana 12.4 detects structured logs produced by OpenTelemetry and surfaces key metadata directly in the log view instead of requiring expansion, improving scanability in high-cardinality environments. The Logs Drilldown application gains the ability to configure default columns and to save and resume log explorations with active filters intact, supporting point-and-click analysis without requiring LogQL queries.
Several data source integrations are updated. Version 6.1 of the Zabbix plugin introduces external dashboard sharing, host tag filtering, query guardrails to prevent API limit breaches, and configurable timeouts. The Google Sheets integration now supports defining a default spreadsheet in the data source configuration, simplifying reuse across dashboards.
Query variable improvements extend to data sources such as PostgreSQL, and regex filtering for query variables addresses display-value mismatches with providers like Amazon CloudWatch, Azure Monitor, and AWS IoT.
Additional usability updates include a new dashboard controls menu that consolidates variables, annotations, and links to reduce visual clutter, as well as multi-property variables that allow a single logical variable to map to multiple identifiers, simplifying complex multi-source dashboards.
For more information, see the announcement or check out the official documentation.