When choosing the right VPS (Virtual Private Server) server for your solution, you may want to test its performance. The most important factors to consider when purchasing a VPS are Internet connection speed, disk I/O speed, and CPU performance.
Of course, the cost of the service is also important, but competition among providers means cheap VPS servers are easily available.
How to Check VPS Network Speed
As you know, network speed is a very important factor since it directly affects the speed of your website, for example. Nothing turns off a site visitor or an online shopper other than sites that load slowly.
You should go with a VPS service provider that offers high network throughput, which will allow your customers or site visitor to receive and send information from the server in the fastest manner possible.
Transfer speeds commonly used by VPS providers, their data centers, and the underlying network carriers are 100 Mbps, 1 Gbps, and up to 10 Gbps. Generally, 100 Mbps and above are considered fast connections.
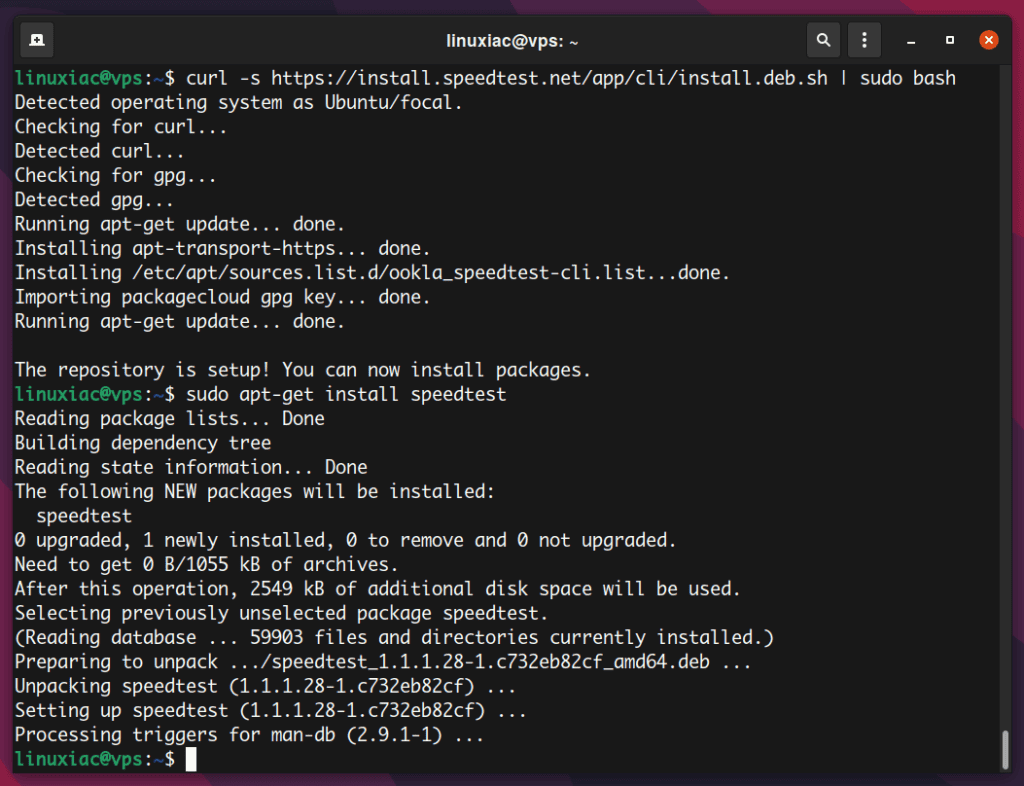
Speedtest.net is renowned for giving rapid and accurate speed test results. But to perform the test from the Linux command line, you will first have to download and install Speedtest CLI. Here’s how to do it.
Installing Speedtest CLI on Ubuntu / Debian
curl -s https://install.speedtest.net/app/cli/install.deb.sh | sudo bash
sudo apt install speedtestCode language: JavaScript (javascript)
Installing Speedtest CLI on AlmaLinux / Rocky Linux / CentOS / RHEL
curl -s https://install.speedtest.net/app/cli/install.rpm.sh | sudo bash
sudo dnf install speedtestCode language: JavaScript (javascript)
The package is now installed and the speedtest.net feature can now execute from the command line. It is important to note that Speedtest will search for the closest server in terms of geographic distance to conduct both download and upload tests.
The command to perform the test is simple, speedtest:
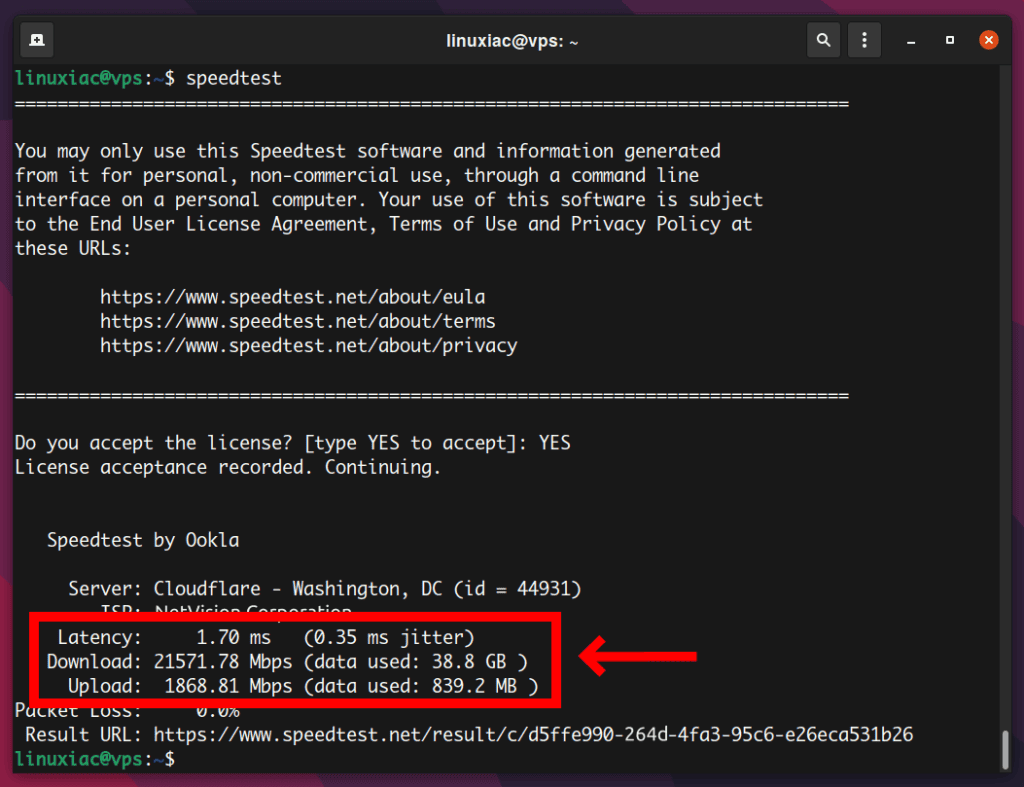
speedtestAfter the speedtest has been completed you’ll receive output similar to the following, containing the server you have connected to and your download and most importantly, upload speed.

- Latency: 1.70 ms: Network latency (delay) is the reaction time of your connection – how quickly your server gets a response after you’ve sent out a request. Up to 50 ms is low latency, so it is considered good.
- 0.35 ms jitter: It is a variance in latency. Jitter is the time delay between transmitting a signal and receiving it over a network connection. Ideally, the jitter should be below 30 ms.
- Download: 2157.78 Mbps: This section tells you the speed that the test server was able to upload data to your server.
- Upload: 1868.81 Mbps: This section tells you the speed that the test server was able to download data from your server.
Upload speed is the most important part of how a server connects to your visitors and the internet. It refers to how many megabits of data per second you can send information from your server to another device or server on the internet.
Therefore, if you’re running a web server, a slow upload speed on your connection is one factor that can cause problems for your users.
So, how can I calculate how many requests per second my server can handle? First, let’s do some math.
According to the upload link speed, we can calculate the number of simultaneous hits (visitors).
If you want to dedicate a decent bandwidth to each visitor, for example 100 KBytes/visitor, a 1868 Mbps link can handle 2391 simultaneous connections per second (1868 Mbps / 8 = 233.5 MBps; 233.5 MBps * 1024 = 239104 KBps; 239104 KBps / 100 KBps = 2391).
Of course, these calculations were according to link speed. We also need to consider server capabilities.
For example, Content Management Systems like WordPress use about 20MB of RAM per hit. So to serve 2391 concurrent http requests per second, the server needs almost 50 GB of free RAM. CPU power should also be estimated in the same way.
Using the dd Command to Benchmark Disk Write Performance
Write speed measures how fast a file can be written onto the drive. You most frequently encounter write speed when trying to copy a file from one location to the other.
The primary purpose of the dd command is to copy a file and convert the format of the data during the process. In addition, the dd command can be also used to monitor the performance of a disk device on a Linux system.
For example, it is useful to find simple sequential I/O (Input/Output) performance.
In this example, we will create a 1GB file using a fairly large block size of 1M. Make sure you have a few gigabytes of free storage space. Then use the following command to test the write speed of your disk:
dd if=/dev/zero of=tmpfile bs=1M count=1024 conv=fdatasyncCode language: JavaScript (javascript)
When writing to the drive, we simply read from /dev/zero, a source of infinite useless bytes. As you can see, it took 1 second to fill that GB, which means that the speed was 932 MB/s. In short, you’ll want this to be above 400 MB/s. This will be comfortably fast for most servers’ operations.
Of course, disk performance may not matter much for certain server workloads. For example, many applications such as Varnish or Redis, cache objects in memory, so the next time you want to read that object, it will be read from memory instead (which is faster).
However, for write-heavy workloads though, the disk still must be accessed.
Using the dd Command to Benchmark Disk Read Performance
Using RAM and CPU in proportion and preferably more power is a smart thing to do. But without fast storage drive to respond to those requests, the technology will not be used to its full potential.
Before benchmarking disk read performance, let’s first delete the server’s buffer cache to measure read speeds directly from the hard drive:
sudo /sbin/sysctl -w vm.drop_caches=3Now that cache is deleted, we can test the read performance of that tmpfile file using:
dd if=tmpfile of=/dev/null bs=1M count=1024Code language: JavaScript (javascript)
Lastly, remember to delete the 1.1GB test file using this command:
rm tmpfileUsing the dd Command to Benchmark CPU Performance
The dd command can also be used for a simple CPU benchmark. Remember that this is a quick method and shouldn’t be used for precise comparisons of CPU performance.
On other hand, it’s perfectly adequate for approximating CPU performance on Linux-based cloud VPSs to ensure you’re getting the power you paid for.
The idea is to force your Linux VPS to perform tasks that will be computationally expensive to force your CPU to work at 100%. Next, this task will be timed.
The shorter times will generally represent a faster CPU and longer results would indicate a slower CPU. Run the below to start the test:
dd if=/dev/zero bs=1M count=1024 | md5sumCode language: JavaScript (javascript)
For most modern CPUs, you’ll want to see a minimum of 300 MB/s. If you see low results, like 100-150-200 MB/sec, it’s a sure sign that whatever system you’re running this on is either overloaded CPU-wise or is hard-limiting your CPU allowance to only some portion of a full CPU core.
