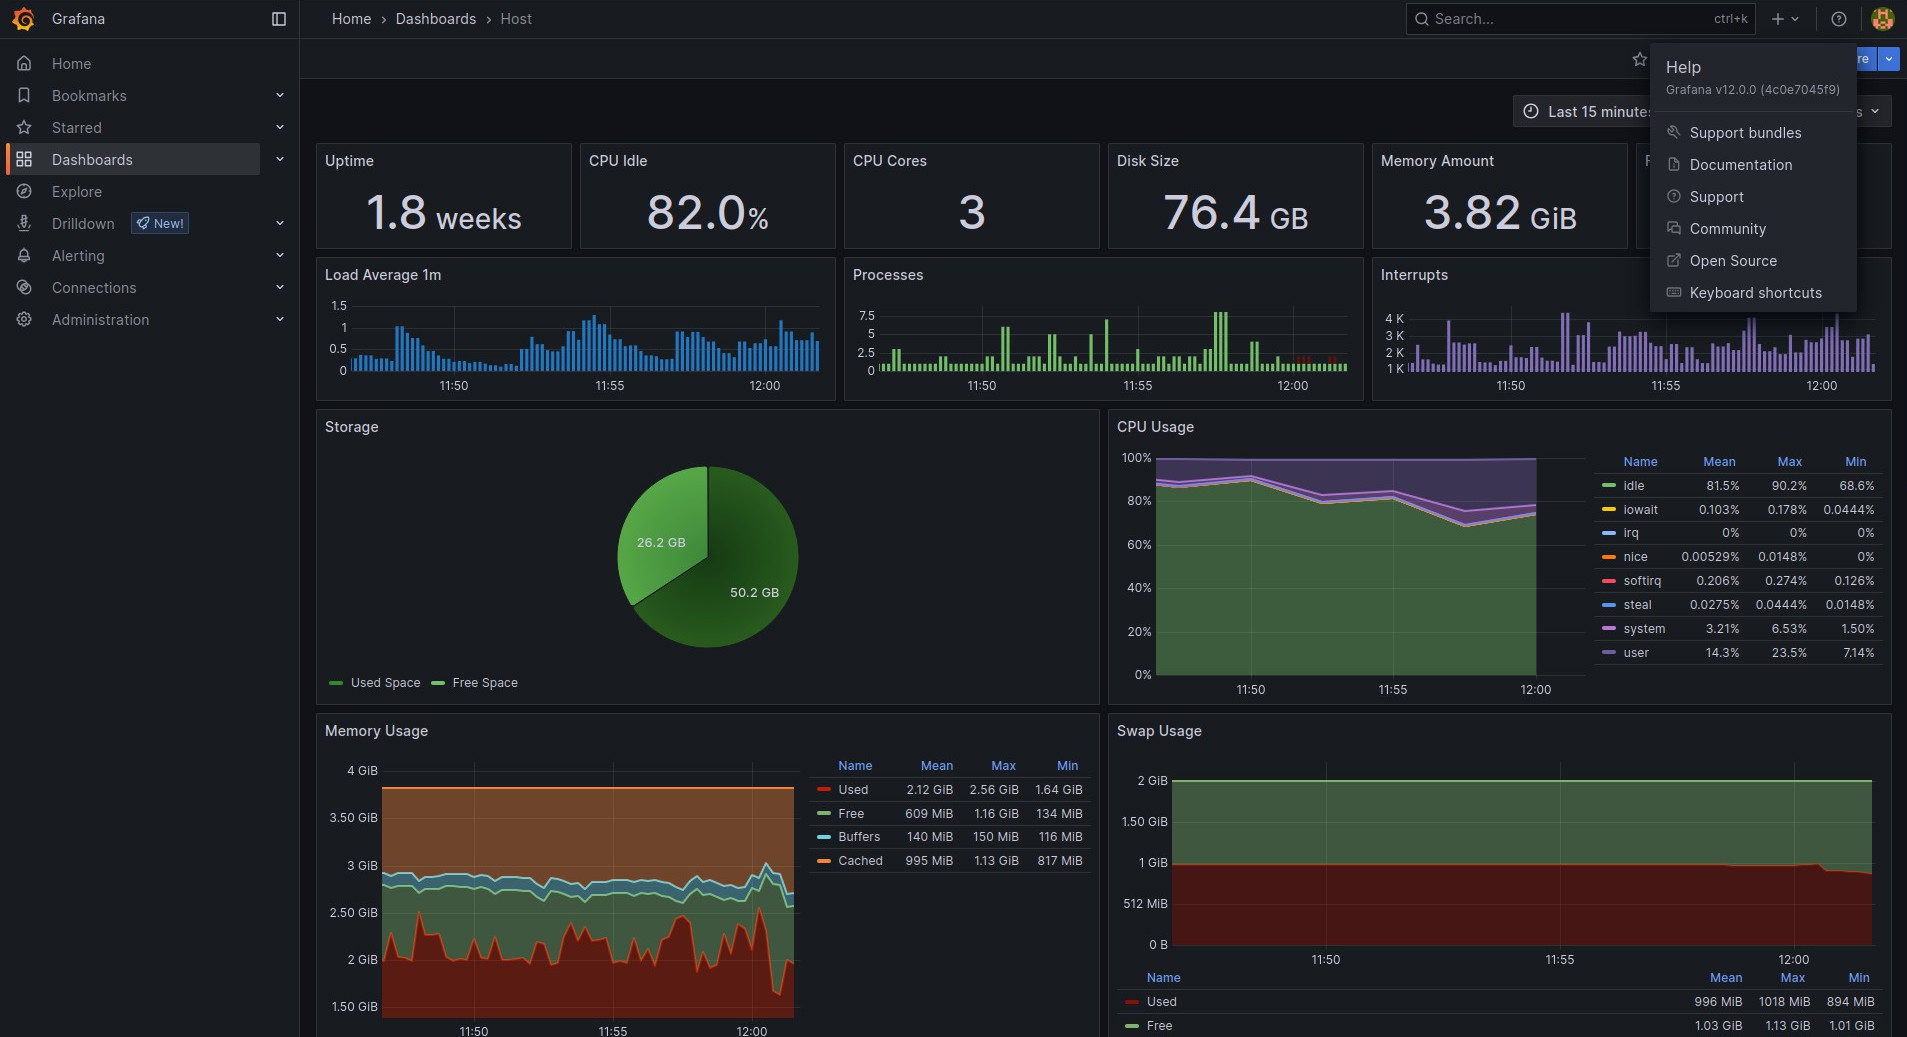
Grafana, an open-source cloud-native observability platform designed for visualizing metrics, logs, and traces collected from various applications, widely adopted in DevOps circles, announced the general availability of version 12.
The main novelty – Grafana 12 formalizes the shift towards “observability as code.” Now, dashboards, alerts, and recording rules can be fully managed through code-centric workflows:
- Git Sync for Dashboards: Users can now connect Grafana directly to a GitHub repository, versioning dashboards alongside application code. Through an intuitive UI, dashboards are created, edited, and merged via pull requests, ensuring full auditability and easier collaboration.
- New Dashboard Schema & APIs (Experimental): Behind the scenes, Grafana’s schema has been re-architected around the concept of “Scenes,” simplifying the JSON structure and paving the way for dynamic layouts, tabs, and conditional rendering. Additionally, experimental REST APIs expose dashboards, folders, banners, and playlists as versioned, resource-oriented entities—a foundation for the brand-new Terraform provider and the forthcoming GrafanaCTL CLI tool.
On the Drilldown enhancements side, since their initial previews, the Drilldown suites for metrics and logs have graduated to GA, with further refinements:
- Metrics Drilldown: Filter metrics more precisely using prefix/suffix matching, group by labels to add context, and sort by recent history or associated dashboards. A collapsible sidebar and real-time metric counts help users focus on the most relevant data.
- Logs Drilldown: Enjoy multiple inclusion filters, first-class regex support, and a dedicated JSON viewer to parse structured log entries. Pagination in service selection and query-direction linkage for “oldest first” or “newest first” queries further enhances the exploration experience.
- Traces Drilldown (GA): Distributed tracing analysis is now fully query-less. Users navigate from high-level RED (Rate, Errors, Duration) golden signals directly into span-level views without writing a single query. Built-in tools—such as highlighting, comparisons, and root-cause correlation—ensure that incident investigations remain contextual and efficient.
Moreover, Grafana 12.0 previews Investigations, a unified interface where panels from metrics, logs, and traces can be assembled side-by-side. By comparing signals across different timeframes and sharing the composite view with teammates, this feature promises to break down silos and speed up root-cause analysis.
Beyond observability, Grafana 12 also addresses the operational challenges of large-scale deployments:
- Cloud Migration Assistant: This tool simplifies the transition from self-managed Enterprise or open-source instances to Grafana Cloud, automating dashboard and visualization imports.
- SCIM User & Team Provisioning (Public Preview): Administrators can now synchronize users and teams directly from SAML identity providers, eliminating manual onboarding steps and reducing operational overhead.
- Alerting Enhancements: A new migration tool converts data-source-managed alert rules (e.g., from Prometheus or Loki) into Grafana-managed rules. Moreover, the “Recovering” state prevents flapping alerts by enforcing a minimum firing duration, and a “Recently Deleted” view allows restoration of accidentally removed alerts.
Apart from the above-mentioned, several experimental features point toward Grafana’s future direction:
- SQL Expressions: Combine and transform data from multiple sources at query time, enabling advanced visualizations and alerting rules that leverage full SQL semantics.
- Dynamic Dashboards: Powered by the new Scenes schema, dashboards can include tabs, conditional rendering, and a content outline for rapid navigation.
- Blazing-fast Table Panel: Thanks to a switch to react-data-grid, loading, scrolling, and sorting large tables now run up to 97 % faster in CPU benchmarks.
On the aesthetic side, Grafana 12 offers five new experimental color themes—Sapphire Dusk, Tron, Gilded Grove, Gloom, and Desert Bloom—accessible via the user profile menu. These themes allow teams to tailor the look and feel of their Grafana instances without touching any code.
Lastly, upgrading to v12 requires awareness of several breaking changes, so be aware of them:
- Deprecated UI Extension APIs Removed: Plugins must adopt the reactive extension APIs introduced in v11.4.
- Removal of
editors_can_admin: Editors can no longer manage teams. - Dashboard v2 Schema Lock-in: Once migrated to the new schema, dashboards cannot roll back under the dynamic layouts flag.
- Metric Name Deduplication:
cache_sizehas been split intoresource_cache_sizeandquery_cache_size, with the original metric deprecated ahead of a v13 removal. - Angular Plugin Support Dropped: All Angular-based plugins will be forced to migrate to React or become unusable.
For more information, see the changelog. The official documentation provides a detailed walkthrough of all the new features and improvements.