
There are many great tools available on Linux for checking processor load, memory usage, temperatures, and other system statistics. Yet people looking for a single app that provides a detailed hardware inventory along with comprehensive real-time sensor monitoring still have fewer polished choices than they do on… Windows. But that could change.
Written in Rust and specifically designed for Linux, HWall is a brand-new open-source software combining hardware information, real-time sensor readings, historical charts, configurable alerts, and the ability to export data via both its native GTK 4 and interactive terminal interfaces.
The project states that its approach to presenting sensor data in a hierarchical structure is influenced by HWiNFO64, a widely used hardware information and diagnostics utility for Windows.
However, rather than just including a number of summary graphs, HWall aims to make available a great deal of information from the Linux kernel, system firmware, hardware drivers, and a number of optional read-only command-line programs.
The app is able to show processor and motherboard temperatures, fan speeds, voltages, levels of usage, clock frequencies, storage activity, network transfer rates, and the power available.
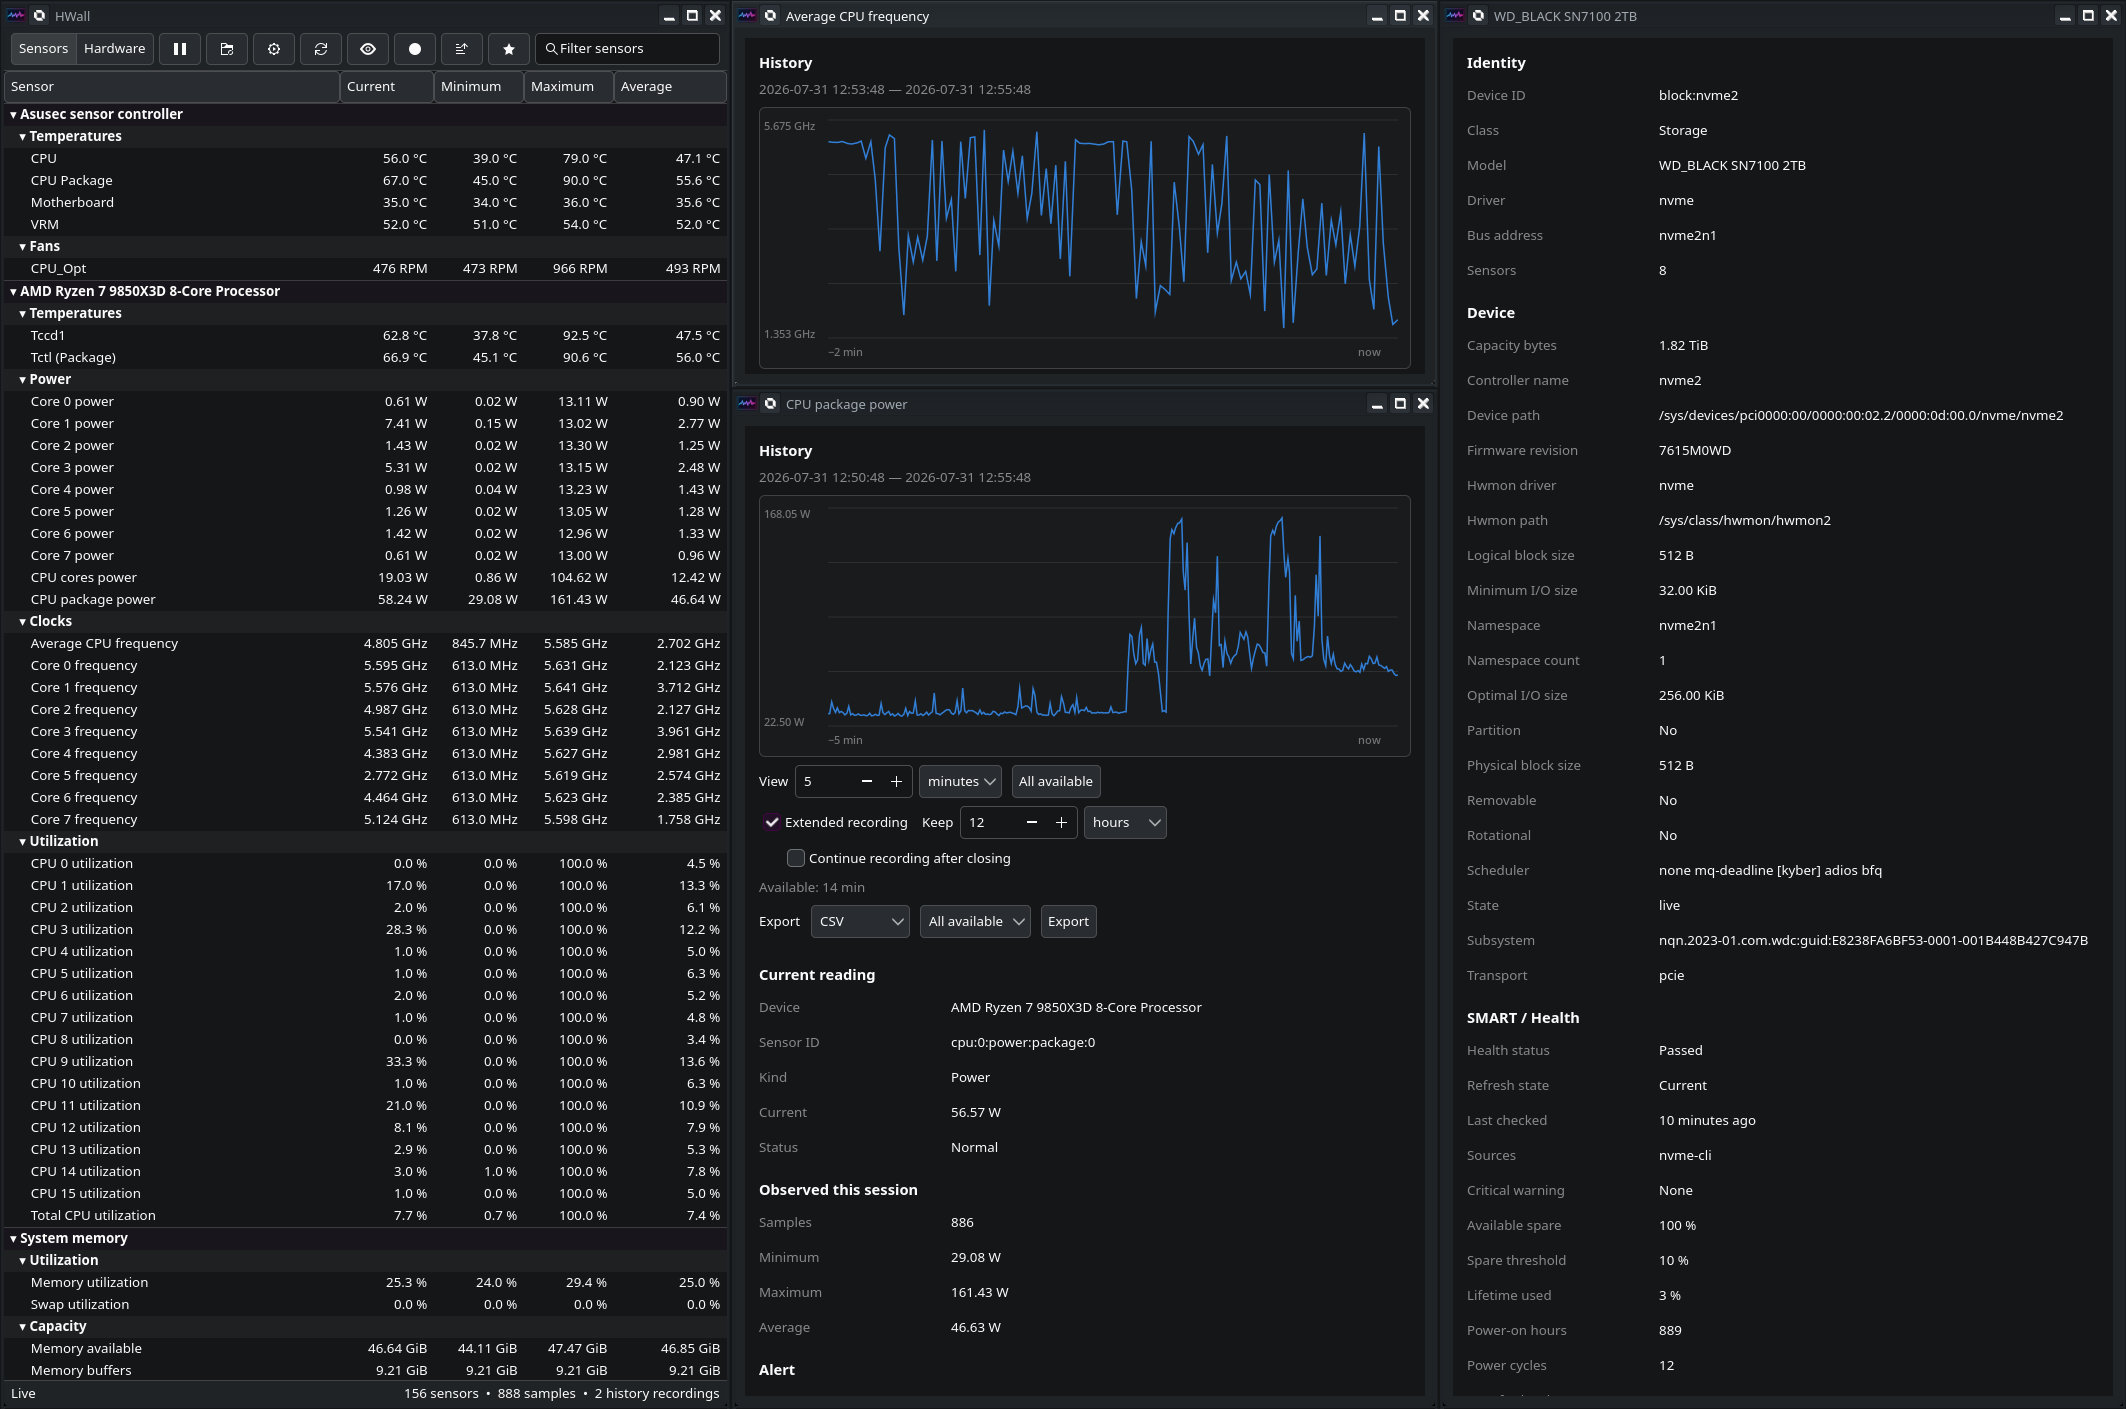
Moreover, on supported x86 systems, it can compute the average and per-logical-CPU effective frequencies using the APERF and MPERF counters, potentially providing a more realistic account of actual CPU operation than simply displaying the requested clock speeds.
Each sensor keeps track of the current, minimum, maximum, and average values, along with the number of samples collected. HWall also distinguishes between stale, unavailable, and offline readings, enabling users to determine whether a value is still being actively updated or merely reflects the last successfully collected sample.
The GTK application arranges the available information in hierarchical Sensors and Hardware views. Users have the option of using the system’s preferred appearance or choosing between light and dark styling. On the other hand, the terminal interface provides Mixed, Sensors, and Hardware modes, which can be switched interactively while remaining within the application.
But one of the really impressive features of HWall is its historical monitoring. The app retains in memory a quantity that can be configured and is able to show this history via interactive charts which allow the user to inspect them on hover, zoom in and out, pan, examine the timestamps, and select specific time periods.
The collected history can be exported in CSV or JSON Lines format for subsequent analysis. The default retention period is 1 minute, but the shared history limit can be extended to 24 hours. It goes without saying that if extremely short sampling intervals are used together with a long retention period, this will increase the amount of processor and memory usage.
Users also have the option of setting warning and critical thresholds for each individual sensor. The alerts include configurable duration, hysteresis, and cooldown values in order to prevent notifications resulting from short temperature or usage spikes. Once this has been done, desktop notifications can be used to alert the user when a reading stays above the configured limit.
In addition to live sensors, HWall maintains a comprehensive record of processors, memory, graphics adapters, storage devices, network interfaces, USB and PCI hardware, batteries, firmware, and any supported security devices. Optional integrations also include SMART and NVMe health information, such as drive warnings, lifetime statistics, and other diagnostic values available.
Systems that use proprietary NVIDIA drivers can make additional GPU telemetry available via nvidia-smi, and HWall can make use of dmidecode to enhance its records of the motherboard, the firmware, the processor socket, the TPM, and the memory module, even though access to some of this information might require elevated privileges.
Motherboard monitoring also requires support from the kernel. HWall takes the values which are already available via Linux’s hwmon subsystem under /sys/class/hwmon, but it does not itself load the sensor modules or ask for administrator privileges just in order to carry out regular monitoring.
As a result, the different readings depend greatly on the motherboard, the monitoring chip, the kernel version, and the driver that has been loaded. The systems that are supported can provide the information via modules including nct6775, it87, asus-ec-sensors, asus_wmi_sensors, w83627ehf, or f71882fg.
Importantly, the app operates in read-only mode and makes no attempt to control the fans, alter the voltages, change the clock frequencies, or write values to hardware. Instead, it concentrates entirely on identifying and reporting what the operating system and the supported helper tools provide.
The command-line application that comes with it can create human-readable reports, filter the sensors by class or type, export data in JSON format, and continuously stream JSON Lines data.
On top of that, HWall features a small HTTP JSON API. Using the serve command in the CLI, users can make the most recent sensor readings, the combined system snapshot, or the hardware inventory available at a configurable local address.
Currently, HWall is only in its very early stages, so users should anticipate certain limitations. The extent of hardware support will depend on Linux driver support, firmware behavior, permissions, and installed utilities.
The developer also cautions against running more than one low-level hardware-monitoring application simultaneously, since some drivers may indirectly cause the firmware or embedded controllers to be queried whenever their exposed sensor files are read.
At the moment, there are also no ready-made release binaries or distribution packages available. Those interested in trying HWall must compile it from source using Rust 1.92 or newer, GTK 4.8 development files, pkg-config, and a standard C build toolchain.
For additional details, visit HWall’s GitHub page.
Image credits: HWall Project



Absolutely amazing tool, Linux tools are quite fragmented, for specific usecases, something like this is a sick solution, hoping it spreads to more repos and that the dev sets up donations, because this is definitely something i would love to support !