
I’ve always had a soft spot for simple applications that stick to the classic UNIX philosophy: do one thing and do it well. That’s exactly why I think the app I’m about to introduce deserves a lot more attention and is worth checking out. Meet Grafito – a simple yet powerful systemd web-based UI log viewer.
For system administrators and Linux enthusiasts alike, keeping tabs on system logs can sometimes feel complex, with all those terminal commands and endless journal entries. Fortunately, Grafito arrives as a breath of fresh air—an elegant, self-hosted, web-based viewer designed to make systemd journal logs effortlessly accessible, readable, and shareable.
At its core, the software offers a clean and intuitive interface that runs on your server. The best part is that Grafito eliminates the traditional need to wrestle with journalctl in the terminal for everyday log monitoring tasks. Instead, users are greeted with a modern and visually pleasant responsive web UI, supporting light and dark modes.
One of Grafito’s standout features is its powerful, dynamic filtering capability. I mean, users can quickly pinpoint relevant logs by typing search queries that filter by systemd unit, syslog tag, time range (like “last 15 min” or “last week”), and log priority. As filters update in real-time while typing, it provides immediate feedback, helping users to zoom in on the exact events they need without delay.
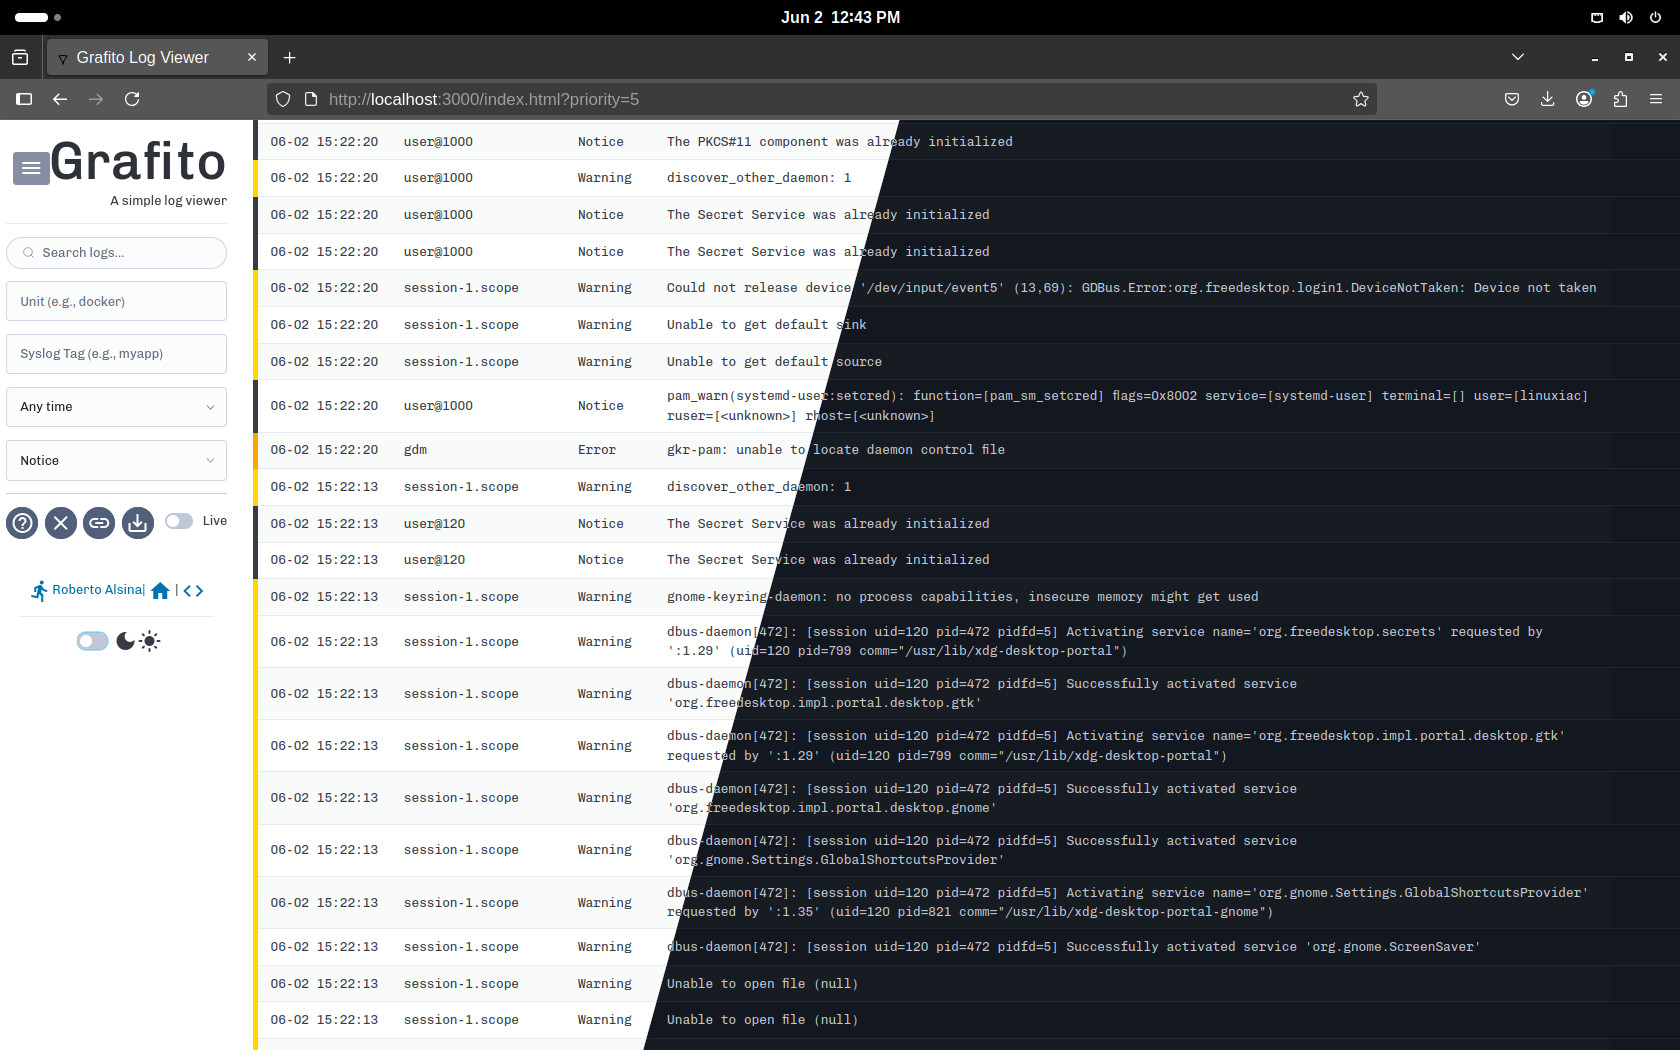
Another practical addition is the “Live View” mode, which streams logs in real-time with automatic updates. Thus, there’s no need to refresh the page during active debugging sessions. Plus, a feature that truly bridges the gap between web-based convenience and command-line transparency is Grafito’s ability to show the equivalent journalctl command for any active filter.
For collaborative or recurring use cases, the tool allows sharing and bookmarking filtered views via URLs containing all current filter settings. Additionally, exporting filtered logs as plain text files is straightforward, enabling offline analysis or archival.
In distributed environments, Grafito’s utility extends even further. Combined with “systemd-journal-remote” and “systemd-journal-upload” services, it enables centralization of logs from multiple hosts into one consolidated journal on the Grafito server. Thanks to the “Hostname” filter, you can effortlessly isolate logs from specific clients within this unified interface.
How to Install the Grafito Systemd Log Viewer
Installation is a breeze. Start by downloading the latest precompiled binary for your Linux architecture from the project’s GitHub releases page. After downloading, set the executable permission with:
chmod +x grafito-static-linux-amd64 Code language: JavaScript (javascript)Make sure your user is added to the “systemd-journal” group to grant log access:
sudo usermod -aG systemd-journal your_userCode language: Bash (bash)Then, just run the binary:
./grafito-static-linux-amd64Code language: JavaScript (javascript)And open your browser at “http://localhost:3000” to access the interface.
For production use, create a systemd service file “/etc/systemd/system/grafito.service” with content similar to:
[Unit]
Description=Grafito Log Viewer
After=network.target

[Service]
Type=simple
User=your_user
Group=systemd-journal
ExecStart=/full/path/to/grafito-static-linux-amd64 -b 0.0.0.0 -p 1111
Restart=on-failure

[Install]
WantedBy=multi-user.targetCode language: Bash (bash)
Finally, reload systemd and enable the service:
sudo systemctl daemon-reload
sudo systemctl enable grafito.service
sudo systemctl start grafito.serviceCode language: Bash (bash)
Now, Grafito will run in the background and start automatically on boot. Access it via “http://<server-ip>:1111“.


OK, but you don’t always get to expose a port and open a web browser to it for every machine you might need to analyze its system journal.
I’m sure this is useful, but its usability case seems a bit limited.
I’ll put it behind Pangolin (tailscale should work as well); Pangolin handles authentication and the encrypted tunnel (Wireguard, actually) from the system running Grafito to my jumphost exposing Grafito.
With ssh, you only need one port.